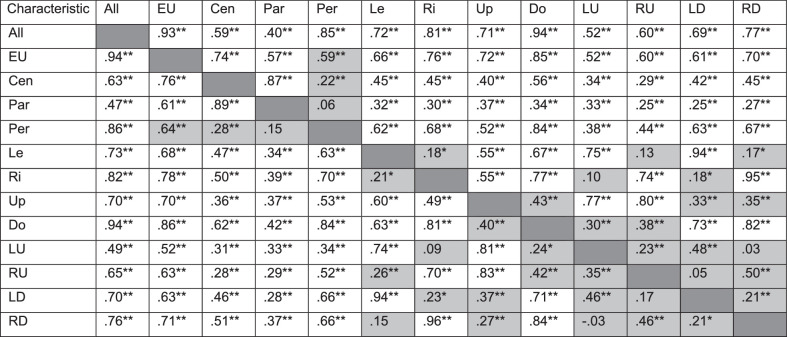
Table 3.
Intracorrelations for the Visual Field Regions

|
Above the diagonal: total population (n = 202); below the diagonal: glaucoma population (n = 114). Pearson correlations for pairs of continuous variables. Shaded cells represent correlations between nonoverlapping regions. Cen, center; Par, paracentral; Per, periphery; Le, left; Ri, right; Do, down; LU, left-up; RU, right-up; LD, left-down; RD, right-down.
P < 0.05.
P < 0.01.
