
Figure 4. Somatosensory cortical neurons encode each stimulus orientation.
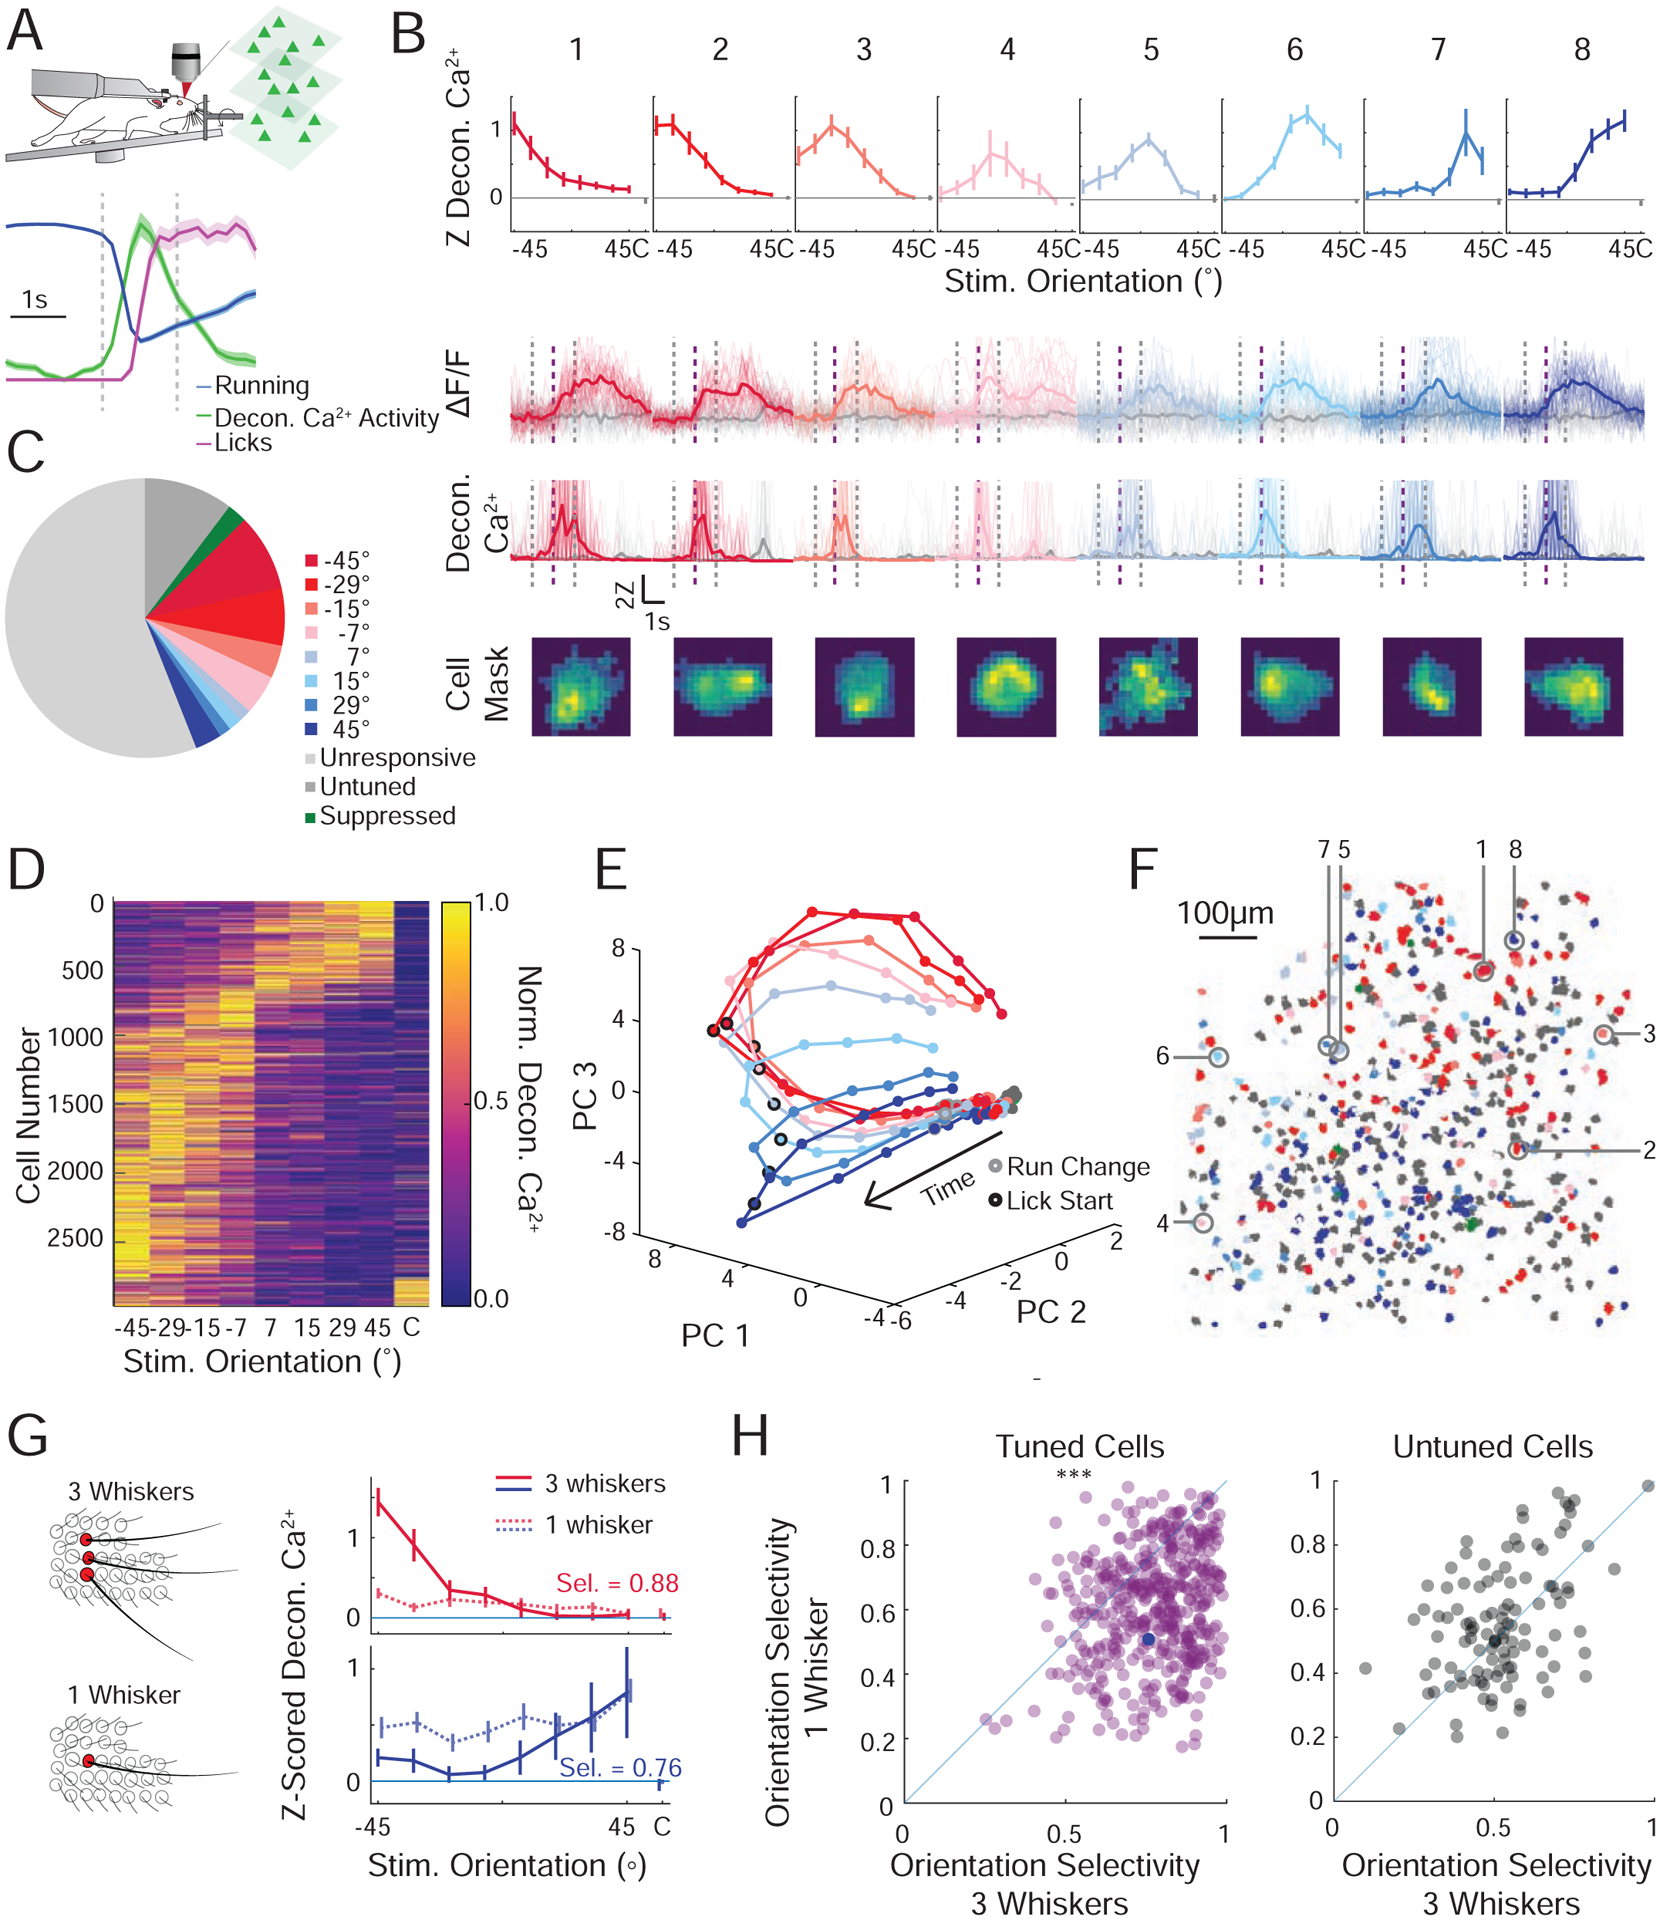
A. Schematic of Ca2+ imaging experiment. Normalized mean ± SEM for run speed (blue), lick rate (magenta), and deconvolved Ca2+ response (all neurons, green). Standard analysis window (vertical dashed lines).
B. Top: Mean z-scored deconvolved Ca2+ responses of 8 representative neurons from the same field of view, tuned to each of the presented stimuli (color coded to preferred stimulus, mean ±95% confidence interval). Middle: Fluorescence response for each neuron during presentation of preferred stimulus (color) or catch trial (gray). Presented as ΔF/F (above) or deconvolved Ca2+ activity (below) (individual trial responses (faint lines), mean response (solid line)). Bottom: Weighted pixel mask from raw images. Scalebar 10μm. Standard analysis window (vertical dashed lines). Lick onset (in GO trials; vertical dashed purple line).
C. Pie chart showing the relative fractions of all imaged neurons that prefer each stimulus orientation (n=10,140 cells, 9 recordings, 4 mice).
D. Cross-validated tuning curves for all significantly tuned cells detected across all mice normalized and sorted by preferred stimulus (determined by half the data that is not shown).
E. Population activity from a representative recording reduced in dimensionality through principal component analysis (PCA). The mean trajectory through PCA space for each oriented stimulus is presented. Each dot is an imaging frame, the time of run deviation (gray circle) and lick onset (black circle) are noted.
F. Stimulus preference map of all neurons recorded in a single recording session; 3 imaging planes are superimposed. Significantly tuned cells are color coded by their preferred orientation (red to blue), untuned but touch-responsive cells (dark gray), unresponsive cells (light gray). The 8 example cells from B are identified.
G. Left: Schematic of the trimming experiment. Right: Orientation tuning curves for two representative neurons during presentation of stimuli with three intact whiskers in an arc (solid line), and a single remaining whisker (lighter dotted line). Inset: orientation selectivity (Sel.) in the three-whisker condition.
H. Scatter plot of orientation selectivity of neurons before (three whiskers) or after trimming to one whisker. Magenta (left), cells that were tuned in the three-whisker condition and responsive in the one whisker condition (n=446 cells, p<3e-41, signed rank test) and gray (right), cells that were untuned (aka touch responsive but not tuned) before trimming and responsive (with any tuning) in the one whisker condition (n=110 cells p=0.32). Cells that were unresponsive before or after trimming are not displayed (n=2 mice; 2138 cells). The bottom example neuron from (I) is marked by a solid blue circle.