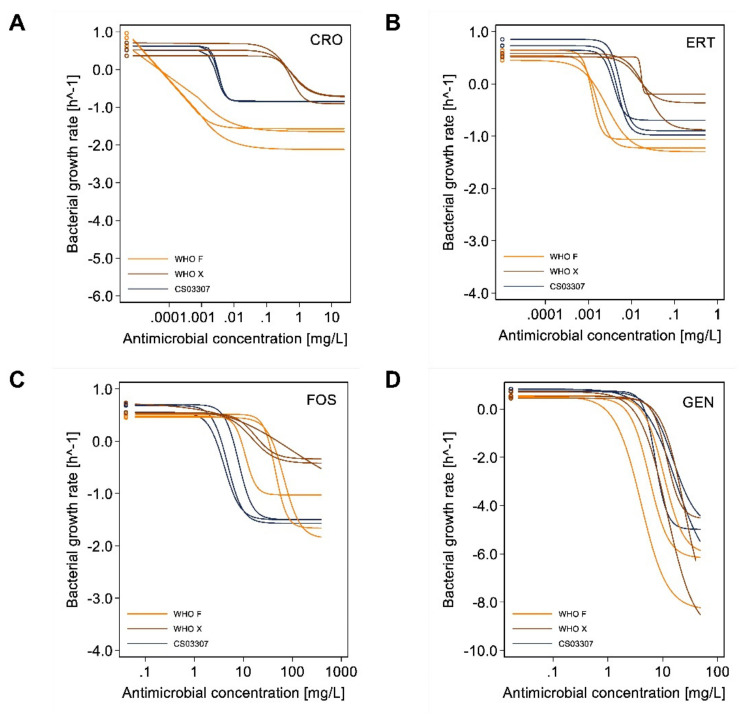
Figure 5.
Curves representing the pharmacodynamic functions of specific antimicrobials (i.e., ceftriaxone (A), ertapenem (B), fosfomycin (C) and gentamicin (D)) for the three different strains of Neisseria gonorrhoeae. Curves for the WHO F strain (ceftriaxone susceptible, high fosfomycin MIC) are presented in yellow lines, WHO X (ceftriaxone resistant, high fosfomycin MIC) in brown lines and CS03307 (ceftriaxone susceptible, low fosfomycin MIC) in navy blue lines. Curves from the three independent experiments with each combination of antibiotic and strain are presented. Abbreviations: CRO, ceftriaxone; ERT, ertapenem; FOS, fosfomycin; GEN, gentamicin.

