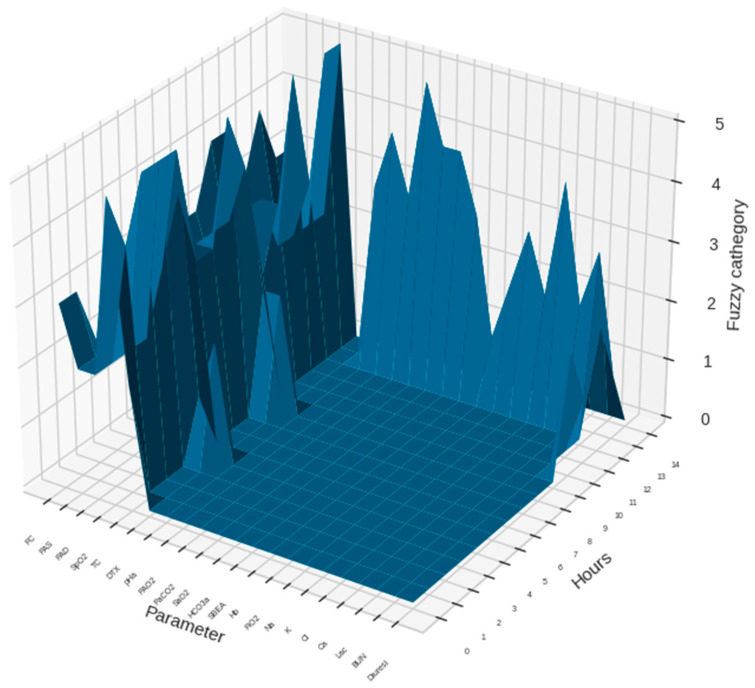
Figure 2.
An example of 14 monitoring hours with a sample of the monitoring parameters in a patient with normalized (fuzzified) data is presented. The dimensional view gives information on the data flow for each parameter during the observation period. Height of the curves in the chart are in units representing the normalized values for each parameter.

