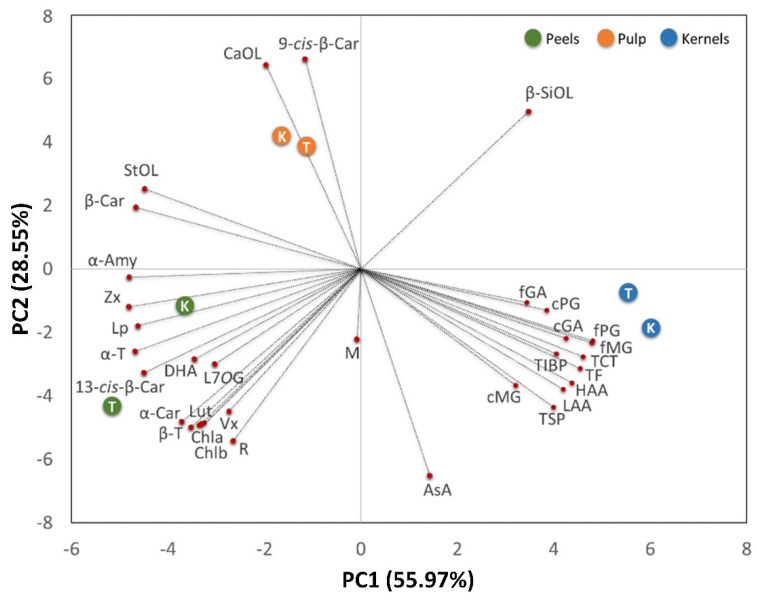
Figure 5.
Principal component analysis (PCA) biplot PC1 vs. PC2 of total soluble phenolics (TSP), total insoluble bound phenolics (TIBP), total flavonoids (TF), total condensed tannins (TCT), free gallic acid (fGA), free methyl gallate (fMG), free propyl gallate (fPG), conjugated gallic acid (cGA), conjugated methyl gallate (cMG), conjugated propyl gallate (cPG), mangiferin (M), rutin (R), luteolin-7-O-glucoside (L7OG), ascorbic acid (AsA), dehydroascorbic acid (DHA), campesterol (CaOL), stigmasterol (StOL), β-sitosterol (β-SiOL), lupeol (Lp), α-amyrin (α-Amy), α-tocopherol (α-T), β-tocopherol (β-T), violaxanthin (Vx), lutein (Lut), zeaxanthin (Zx), α-carotene (α-Car), β-carotene (β-Car), 9-cis-β-carotene (9-cis-β-Car), 13-cis-β-carotene (13-cis-β-Car), chlorophyll a (Chla), chlorophyll b (Chlb), hydrophilic antioxidant activity (HAA) and lipophilic antioxidant activity (LAA) of different fruit tissues (pulp, peels and kernels) isolated from the ripe fruits of Tommy Atkins (T) and Keitt (K) mango cultivars. The variance (%) explained by each PCA axis is given in brackets. The length of the vectors is correlated to their significance within each population. Between vectors and between a vector and an axis, there is a positive correlation if the angle is <90°, whereas the correlation is negative if the angle reaches 180°. There is no linear dependence if the angle is 90°.

