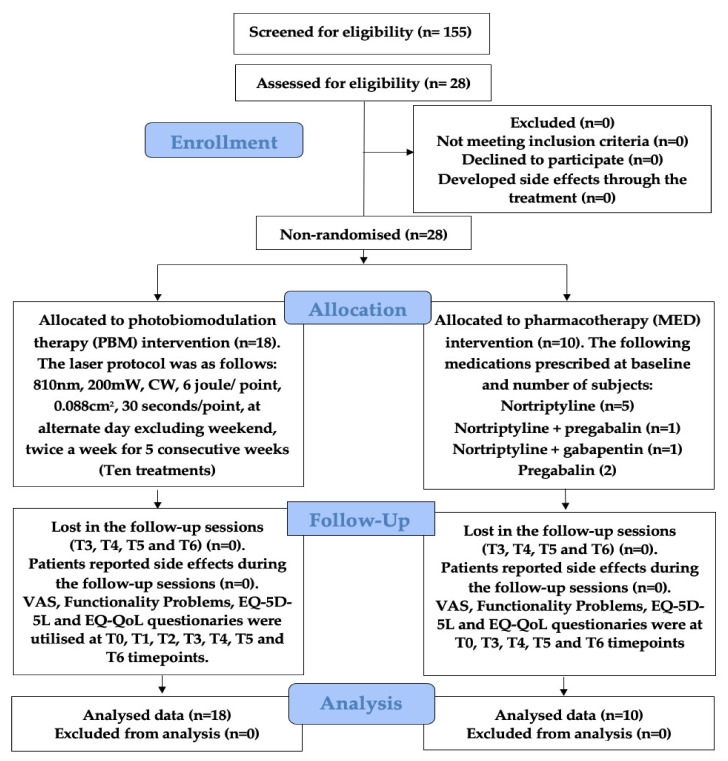
Figure 5.
Illustrates the CONSORT diagram flow of subjects’ enrolment, allocation, follow-up and analysis for both groups: PBM and MED, including the treatments and follow-up protocols. Abbreviations: T0: baseline (Pre-treatment); T1: mid-treatment; T2: end-treatment; T3: one-month; T4: three-months; T5: six-months; T6: nine-months; VAS: visual analogue scale; EQ-5D-5L: European-QoL-5 dimensions 5 levels; mW: milliwatt; CW: continuous emission mode; n: number (Supplementary File S2).

