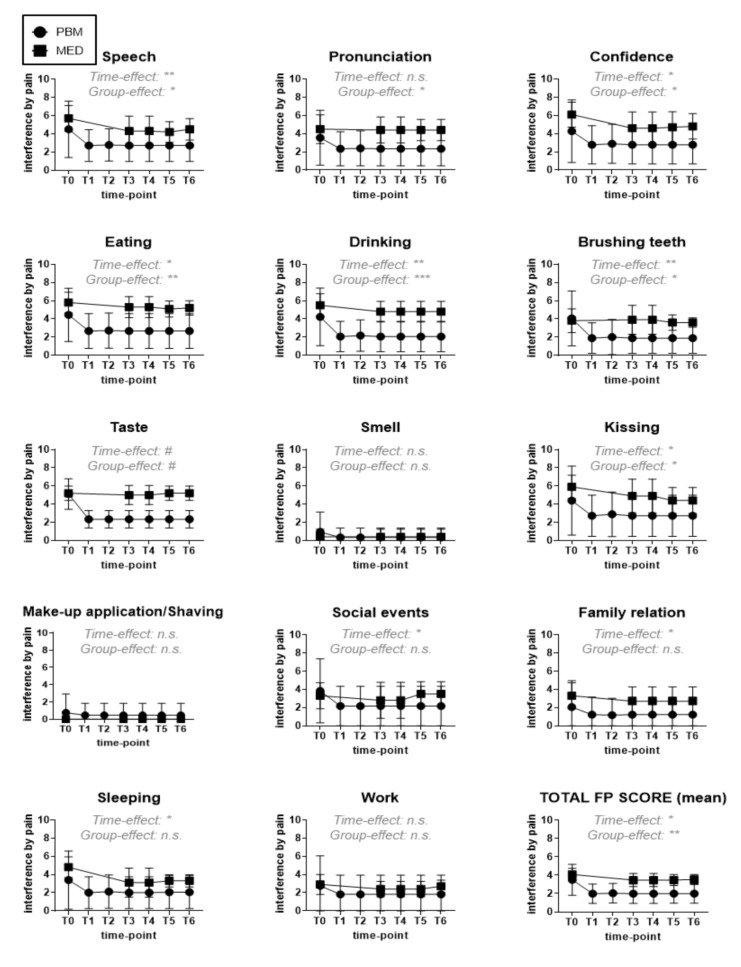
Figure 9.
Pain interference with 14 functional indices as experienced and self-reported by the study participants on a scale from zero (=no interference) to ten (total interference or complete loss of functionality), allocated to either PBM (circles) or MED (squares) intervention groups. The functional parameters assessed, relating to QoL, are depicted above in each graph, as well as the significance level of the main effects by ANOVA analysis (Group-effect = intervention dependency, Time-effect = time-point dependency) for the respective functional parameter in the study (n.s. = not significant; * < 0.05; ** < 0.01; *** < 0.001; # < 0.0001). Abbreviations: T0: baseline; T1: mid-treatment; T2: end-treatment; T3: one-month; T4: three-months; T5: six-months; T6: nine-months.

