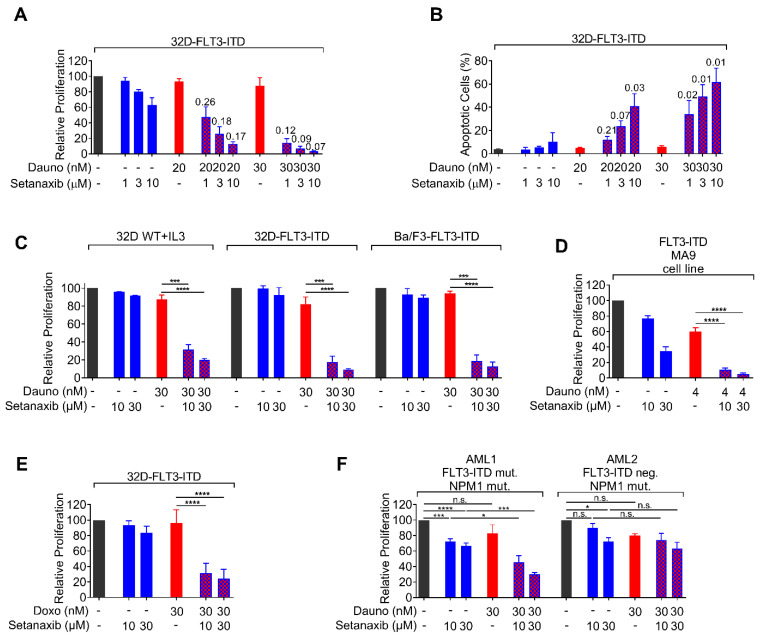
Figure 2.
Effect of the single and combined drug treatments on proliferation/viability and induction of apoptosis in AML cells. (A) 32D-FLT3-ITD cells were seeded in 96-well plates, single compounds or combinations of compounds (daunorubicin, Setanaxib, or combinations) were added, and the proliferation/viability was assessed by Cell Titer Blue assay after 72 h. The fluorescent signal, which was directly proportional to the number of viable cells, was measured in a plate reader at 540/610 nm (excitation/emission, respectively, RFU-relative fluorescence units). (B) Apoptosis rate was measured by FACS analysis using Annexin V/7-AAD staining after 48 h of single or combined treatments with daunorubicin and Setanaxib. The combination index was determined using the software Calcusyn. The obtained ‘combination index (CI)’ numbers are shown above the bars. Three independent experiments were conducted; error bars represent mean ± SD. (C) Comparison of synergistic effects in wildtype (WT) FLT3-expressing 32D-cells, FLT3-ITD-expressing 32D- cells, and Ba/F3-FLT3-ITD cells. Note that the cultivation of WT-FLT3 32D cells requires addition of IL-3 to the medium. (D) Synergy of Setanaxib and daunorubicin in a murine leukemic cell line transformed with FLT3-ITD and MLL-AF9 obtained as indicated in the legend to Figure 1. (E) Synergy of Setaxanib with doxorubicin in 32D-FLT3-ITD cells. The individual experiments were normalized to DMSO controls. Three independent experiments (with technical triplicates) were conducted; error bars represent mean ± SD. (**** p < 0.0001 by two-tailed t-test). Note that for clarity in (C–E) only selected statistical comparisons are shown to emphasize the synergistic effects of Setanaxib addition to a dose of anthracycline, which has limited effect alone. (F) Synergy of Setanaxib with daunorubicin in primary human AML cells. Primary patient PBMCs were isolated by Ficoll density gradient separation. Cells (100,000 cells/well) were treated with drugs or their combinations as indicated. Proliferation was assessed as in (A). The individual experiments were normalized to DMSO controls. Error bars represent mean ± SD. Statistical analyses were carried out using one-way ANOVA with Tukey’s post-test. (n.s.—not significant, * p < 0.05 and *** p < 0.001).

