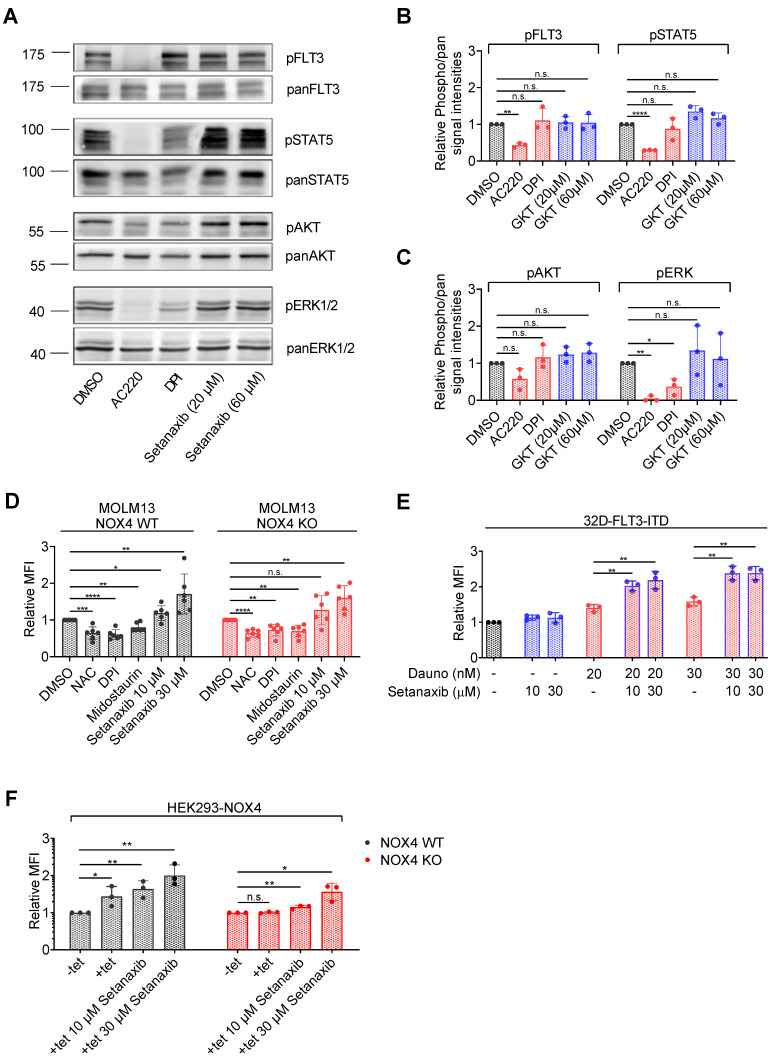
Figure 5.
Setanaxib promotes ROS formation elicited by daunorubicin. (A–C) MV4-11 cells were treated with the indicated concentrations of the FLT3-ITD inhibitor AC220 (quizartinib, positive control), the general NOX inhibitor diphenyleneiodonium (DPI), or Setanaxib for 4 h in serum-free medium. Thereafter, cells were lysed and lysates subjected to immunoblotting for assessment of pathway activation. Blots were probed with activation-specific antibodies to pFLT3 (pY589/591), pSTAT5 (pY694), pAkt (Ser473), or pErk1/2 (Thr202/Tyr204) antibodies. Subsequently, blots were stripped and comparable loading was validated by reprobing of the membranes with antibodies against FLT3, STAT5, Akt, or Erk as indicated. (A) Representative result. (B,C) Quantification of three independent experiments for the indicated signaling molecules. Setanaxib (GKT137831) is abbreviated as GKT. Error bars represent mean ± SD. Statistical analyses were carried out with two-tailed t-test. (D) MOLM-13 cells were treated with 5 mM NAC (positive control), 500 nM of the general NOX inhibitor diphenyleneiodonium (DPI), 40 nM of the protein kinase inhibitor midostaurin, or 10 or 30 µM Setanaxib for 24 h. Thereafter, cells were stained with H2DCFDA for 30 min and ROS levels were quantified on the flow cytometer (MFI, mean fluorescence intensity). Error bars represent mean ± SD, (n = 3). Statistical analyses were carried out using two-tailed t-test. (E) The 32D-FLT3-ITD cells were treated with the indicated concentrations of the drugs for 24 h. Thereafter, cells were stained with ROS Deep Red dye for 30 min and ROS levels were quantified by flow cytometry. The experiment was conducted three times independently. Error bars represent mean ± SD, (n = 3). Statistical analyses were carried out using two-tailed t-test. (F) HEK293 cells with tetracycline (tet)-inducible NOX4 overexpression and engineered to constitutively express Cas9 were kept uninduced (−tet) or were induced (+tet) to overexpress NOX4 and were mock-treated with solvent or were treated with Setanaxib as indicated. ROS formation was scored with H2DCFDA as in (D). Error bars represent mean ± SD, (n = 3). Statistical analyses were carried out using two-tailed t-test (n.s.—not significant, * p < 0.05, ** p < 0.01, *** p < 0.001, and **** p < 0.0001).

