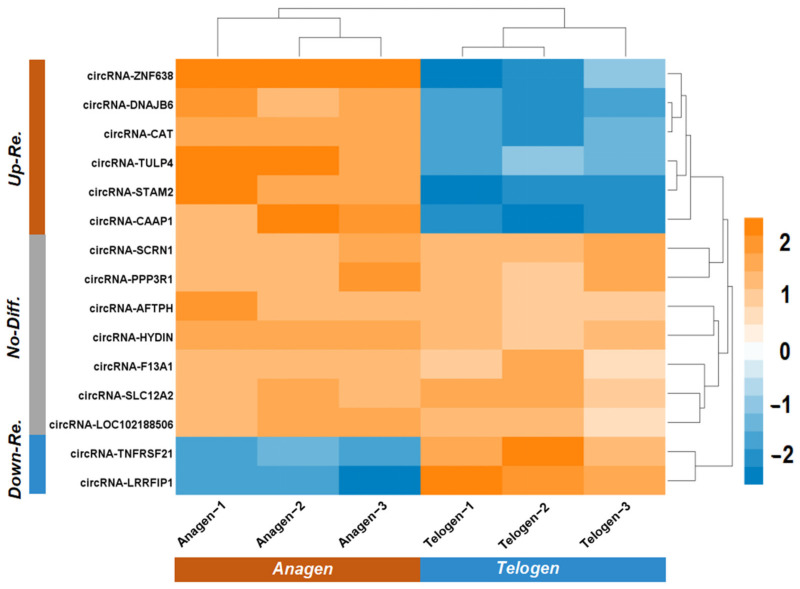
Figure 3.
Expression analysis of 15 putative m6A-circRNAs in skin tissue of cashmere goats at both anagen and telogen stages presented as a hierarchical clustering heatmap. The “Up-Re” indicates the expression mean of putative m6A-circRNAs being significantly up-regulated in skin tissue at anagen of cashmere goats in comparison to telogen (p < 0.05). The “Down-Re” indicates the expression mean of putative m6A-circRNAs being significantly down-regulated in skin tissue at anagen of cashmere goats in comparison to telogen (p < 0.05). The “No-Diff” indicates no significant difference in expression mean of putative m6A-circRNAs in skin tissue of cashmere goats between anagen and telogen stages (p > 0.05). The resulting p-value for each comparison is presented in Table S1.

