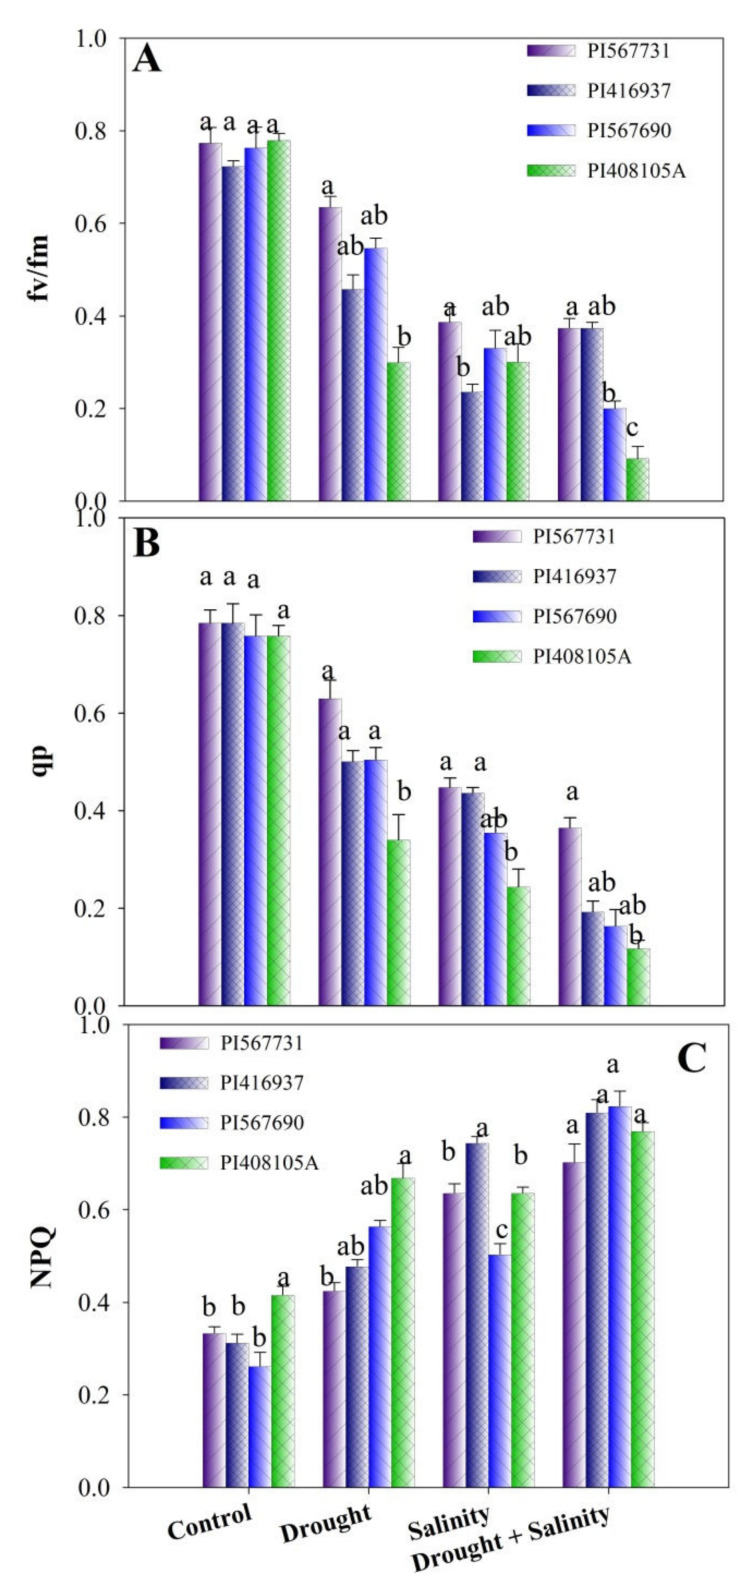
Figure 4.
(A) Fv/Fm, (B) non-photochemical quenching (NPQ), and (C) photochemical quenching (qP) of four soybean cultivars grown under drought and salinity stress conditions. Data presented are means ± SD, and different letters denote a significant difference at p < 0.05 based on the least significant difference (LSD) test. Letter a is highly significant than b, and ab means no significant differences between a with ab and b with ab.

