Figure 2.
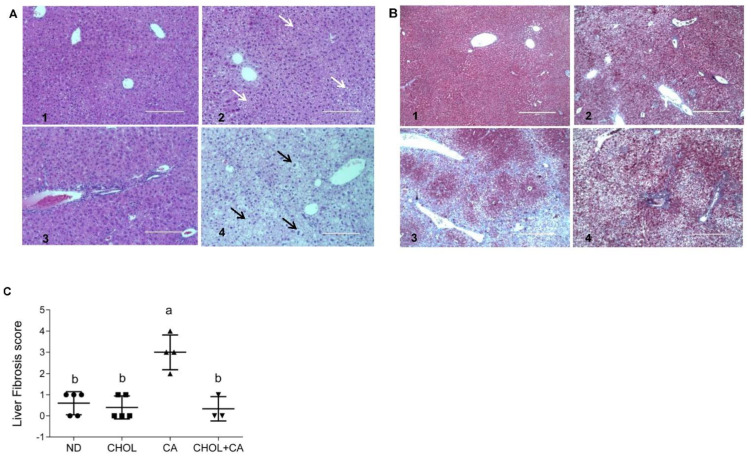
Effect of dietary cholesterol and cholic acid supplementation on tissue histology of features of fibrogenesis. Male C57BL/6J mice aged four to five weeks were fed: ND—normal diet, CHOL—cholesterol diet, CA—cholic acid diet, CHOL + CA—cholesterol and cholic acid diet for six weeks, with five animals in each treated group. (A) Representative liver H&E staining under ×20 magnification, scale bar 200 μm, for (A1) ND group; (A2) CHOL group (presence of microvascular fat accumulation marked with white arrows); (A3) CA group (presence of necrotic cells with malformed nuclei); (A4) CHOL + CA group (presence of ballooning degeneration of hepatocytes, accumulation of lipid droplets and Mallory-Denk bodies). Hepatocyte ballooning marked with black arrows. (B) Representative liver Masson’s trichrome staining under ×40 magnification, scale bar 400 μm, for (B1) ND group; (B2) CHOL group (few visible collagen lesions); (B3) CA group (high presence of fibrotic collagen lesions colored blue); (B4) CHOL + CA group (few visible collagen lesions). (C) Liver fibrosis score. Columns indicated with different letters (a, b) are significantly different (p < 0.05) in Tukey-Kramer post-hoc test.

