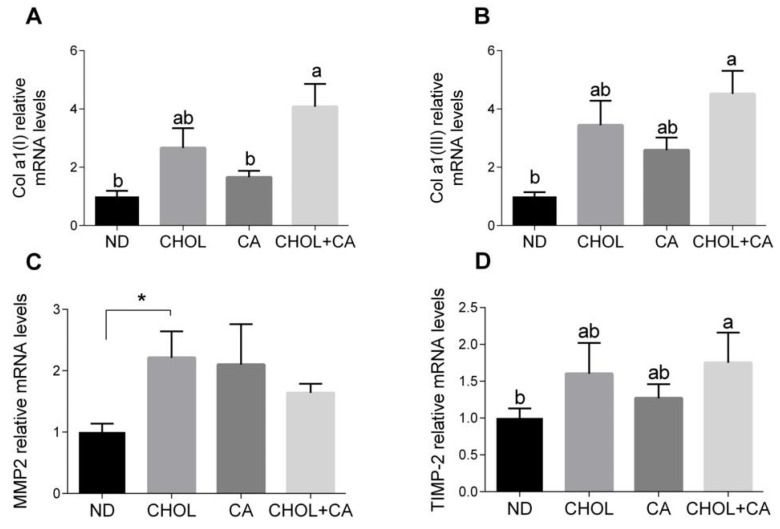
Figure 3.
Effect of dietary cholesterol and bile acids on ECM genes. Male C57BL/6J mice aged four to five weeks were fed: ND—normal diet (n = 10), CHOL—cholesterol diet (n = 10), CA—cholic acid diet (n = 9), CHOL + CA—cholesterol + cholic acid diet (n = 8) for six weeks. (A) Col a1(l) relative mRNA levels. (B) Col a1(lll) relative mRNA levels. (C) MMP2 relative mRNA levels. (D) TIMP-2 relative mRNA levels. All values are expressed as mean ± SEM; columns marked with * are different from control according to Student’s t-test (p < 0.05); columns marked with different letters (a, b) are significantly different (p < 0.05) in Tukey-Kramer post-hoc test.

