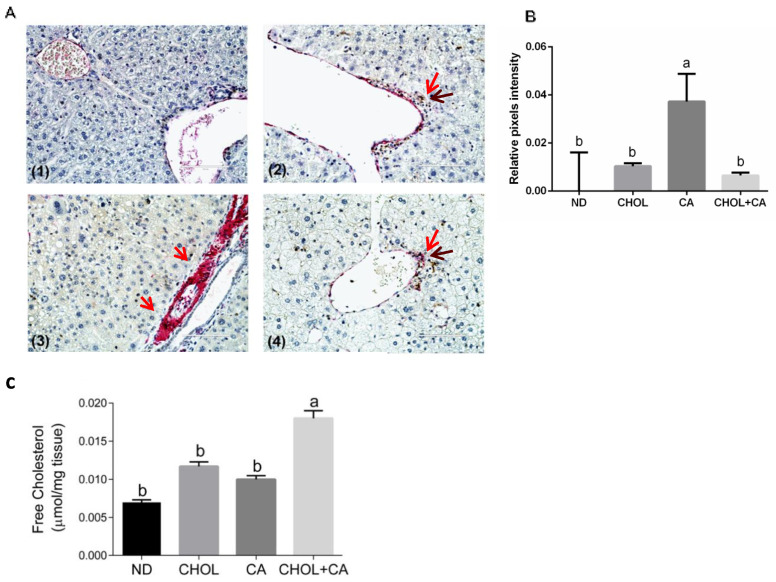
Figure 4.
Dietary cholesterol and cholic acid effect on hepatic stellate cells’ apoptosis and liver tissue fibrosis. Male C57BL/6J mice aged four to five weeks were fed: ND—normal diet (n = 10), CHOL—cholesterol diet (n = 10), CA—cholic acid diet (n = 9), CHOL + CA—cholesterol and cholic acid diet (n = 8) for six weeks. (A) Representative histology of liver cleaved caspase-3 (brown) and αSMA (red) sequential double immunohistochemical staining, ×40 magnification, scale bar 100 µm; dietary-induced NAFLD models of (1) ND, (2) CHOL, (3) CA and (4) CHOL + CA, with five animals in each treated group. Red arrows represent αSMA stained cells; brown arrows represent cleaved caspase-3-stained cells. (B) Histological sections of three individuals from each group were imaged using the EVOS M500 microscope. Two frames from each slide were captured at a magnification of ×200. All captured images were at a resolution of 2048 × 1536 pixels and saved as TIF files. ImageJ software was employed to determine the relative intensity of pixels from the red channel (red/green + blue) of the total area of each image. For graphical presentation, the average value for the relative pixel intensity of the ND group was subtracted from those of all treatments. (C) Levels of free cholesterol in the liver. All values are expressed as mean ± SEM. Columns indicated with different letters (a, b) are significantly different (p < 0.05) in the Tukey-Kramer post-hoc test.

