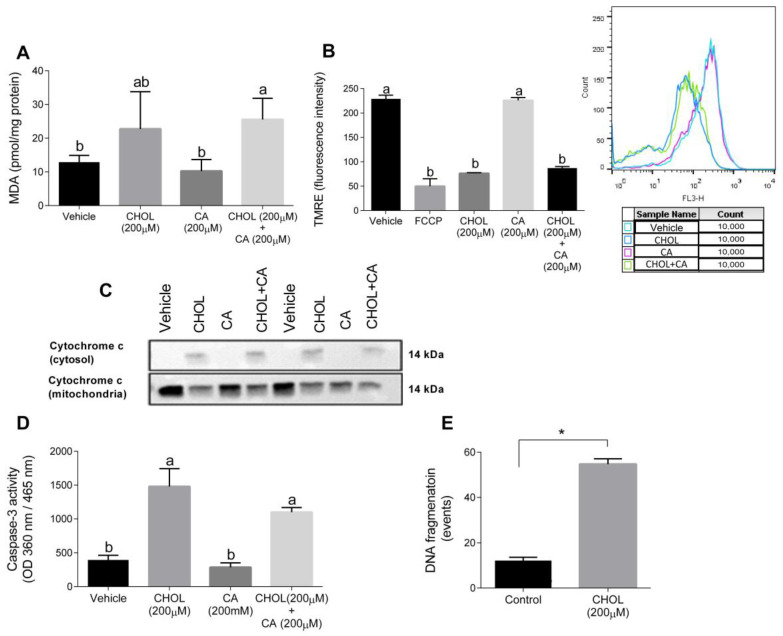
Figure 8.
Cholesterol induces oxidative, mitochondrial stress and apoptosis in HSC-T6. HSC-T6 were exposed for 12–24 h to cholesterol (CHOL, 200 µM), cholic acid (CA, 200 µM), cholesterol with cholic acid (CHOL + CA, 200 µM) or the vehicle (treated with 0.1% DMSO). (A) HSC-T6 MDA cell content. (B) HSC-T6 mitochondrial membrane potential. (C) Cytochrome c leakage from mitochondria to cytosol 12 h post-treatment. (D) Caspase-3 activity 12 h post-treatment. (E) DNA fragmentation 24 h post-treatment. All values are expressed as the mean ± SD. Columns marked with * are different from control according to Student’s t-test. (p < 0.05), n = 4. Columns marked with different letters (a, b) are significantly different (p < 0.05) in the Tukey-Kramer post-hoc test. FCCP, potent uncoupler of mitochondrial oxidative phosphorylation.

