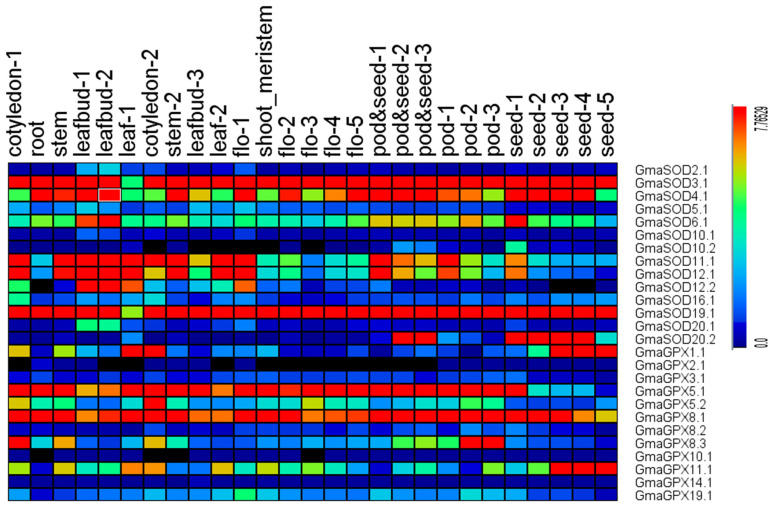
Figure 9.
Expression profiles of the SOD and GPX genes in soybean, including different organs, tissues, and developmental stages. Data were normalized based on the mean expression value of each gene in all tissues analyzed. Flo-1: 1st flower, Flo-2: 2nd flower, Flo-3: 3rd flower, Flo-4: 4th flower, Flo-5: 5th flower.

