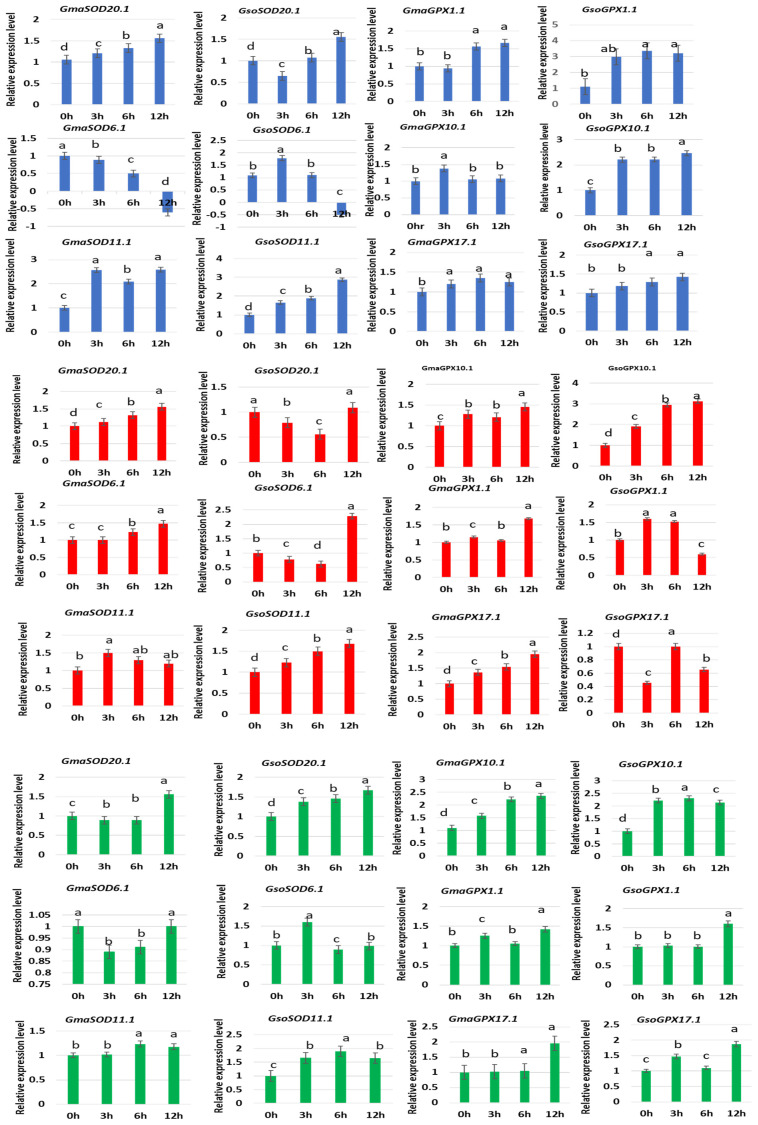
Figure 10.
Expression of different selected SOD and GPX genes of G. soja under different stresses viz H2O2 (blue color), NaCl (red color) and PEG (green color). Data represent mean and standard deviation of three repeats (n = 3). Data with the same letters in lowercase (a, b, c and d) above bars indicate no significant differences at the 0.05 level at different time intervals in the soybean genotype according to the Duncan’s multiple range test.

