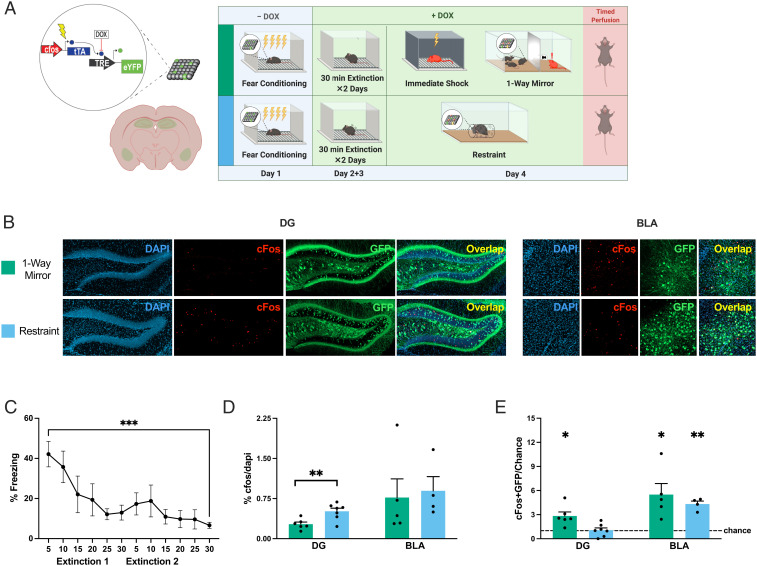
Fig. 3.
Socially salient experiences reactivate fear ensembles post fear extinction. (A) Schematic representation of the DOX-mediated viral tagging construct (Left) and experimental design (Right). (B) Confocal visualization of DG and BLA histology showing cFos-tTa + Tre-EYFP–labeled cells (active during FC; green) and cFos+ cells (active during the different types of stress exposure; red). (C) Freezing throughout extinction training (repeated-measures one-way ANOVAF(3.230, 25.84) = 5.165, P = 0.0054, Holm–Sidak’s multiple comparisons for first vs. last 5 min, n = 9, t = 5.688, ***P = 0.0005). (D) Percentage of cFos+ cells per DAPI+ cells (DG: t test, t = 3.268, df = 11, **P = 0.0075; BLA: t test, t = 0.2716, df = 7, P = 0.7938). (E) Degree of overlap between the two labeled populations normalized over chance (% cFos/DAPI × % EYFP/DAPI). One-sample t tests. DG: restraint: t = 0.195, df = 6, P = 0.8516; one-way mirror: t = 3.67, df = 5, *P = 0.0153. BLA: restraint: t = 9.031, df = 3, **P = 0.0029; one-way mirror: t = 3.257, df = 4, *P = 0.0312. The dashed line represents chance. Data are shown as mean ± SEM.

