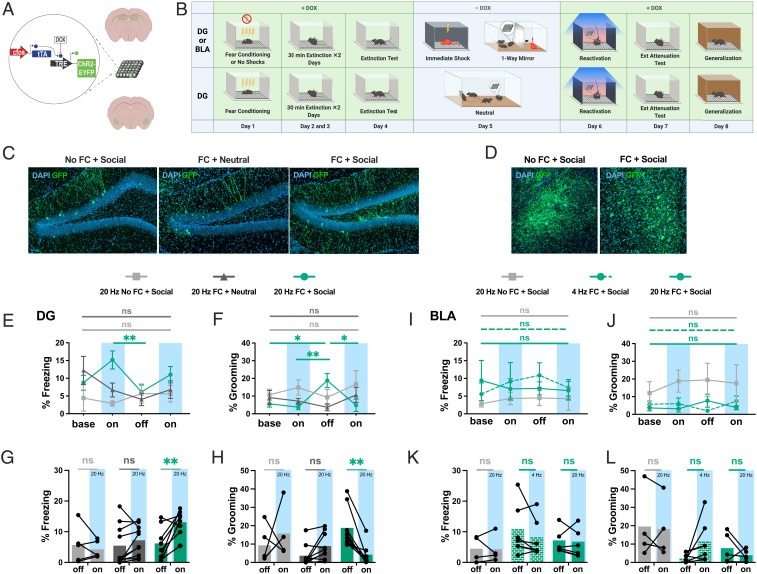
Fig. 4.
DG ensembles active during social stress drive fear only in previously fear-conditioned mice. (A) Schematic representation of activity-dependent engram tagging strategy. (B) Behavioral schedule. (C and D) Representative images of DAPI+ cells (blue) and Chr2-EYFP+ cells (green) in the DG (C) and BLA (D). (E and I) Percent freezing levels throughout optogenetic stimulation of cells active in the DG (E) and BLA (I): two-way ANOVA, Holm–Sidak’s multiple comparisons: for fear-conditioned DG first light-on vs. light-off: t = 3.821, *P = 0.0385. (F and J) Percent self-grooming levels throughout optogenetic stimulation in the DG (F) and BLA (J): two-way ANOVA, Holm–Sidak’s multiple comparisons: for fear-conditioned DG for light-off vs. baseline: t = 2.897, *P = 0.0211; vs. first light-on: t = 3.330, **P = 0.0091; vs. second light-on: t = 2.09, *P = 0.0153. (G and K) Percent freezing levels for the light-off and the averaged light-on sessions in the DG (G) and BLA (K): two-way ANOVA, Holm–Sidak’s multiple comparisons: for fear-conditioned DG light-on vs. light-off: t = 4.072, **P = 0.0018. (H and L) Percent self-grooming levels for the light-off and the averaged light-on sessions in the DG (H) and BLA (L): two-way ANOVA, Holm–Sidak’s multiple comparisons: for fear-conditioned DG for light-on vs. light-off: t = 3.5578, **P = 0.006. Data are shown as mean ± SEM in E, F, I, and J. ns, not significant. Detailed statistics are shown in SI Appendix, Supplementary Text. See also SI Appendix, Fig. S5.

