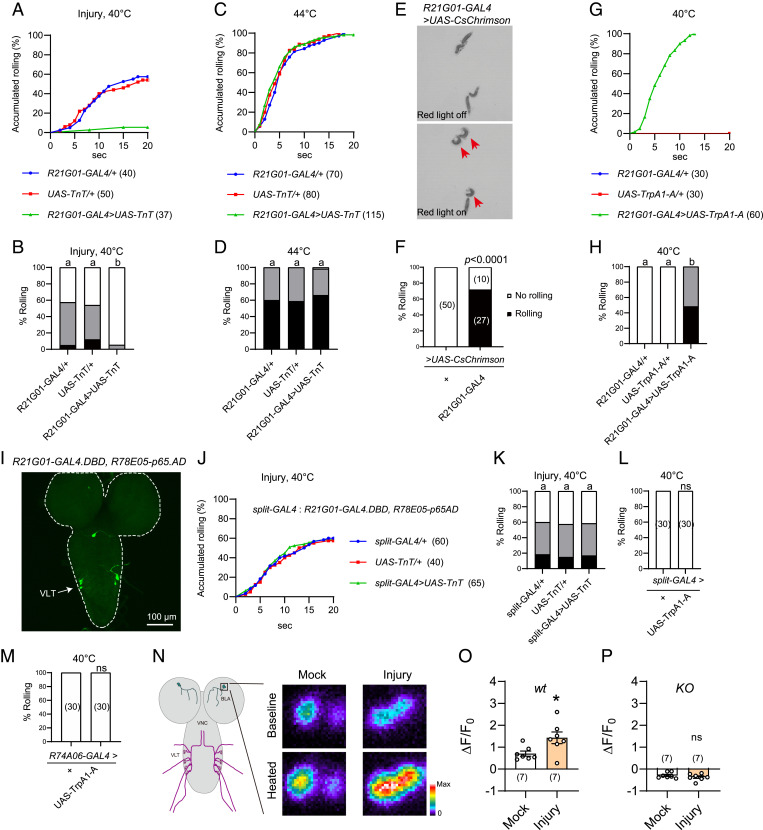
Fig. 3.
BLA neurons mediate heat responses in the allodynia state. (A and B) Behavioral responses of larvae bearing R21G01-GAL4 > UAS-TnT to a 40 °C heat probe, at 24 h after UVC treatment. (C and D) Behavioral responses of larvae bearing R21G01-GAL4 > UAS-TnT to a 44 °C heat probe, without UVC treatment. (E and F) Optogenetics-induced rolling behavior of larvae bearing R21G01-GAL4 > UAS-CsChrimson. 2.1 × 2.1 cm2 test fields are shown. Larvae displaying rolling are indicated with arrows in E. Here, behavioral responses are categorized into two groups, no rolling (white bar, if no rolling was observed during 20 s of light stimulation), and rolling (black bar, rolling occurred in 20 s). (G and H) Rolling behavior of larvae bearing R21G01-GAL4 > UAS-TrpA1-A, in response to a 40 °C-heat probe. (I) VLT neurons in larval ventral nerve cord were specifically labeled by the split-GAL4 (R21G01-GAL4.DBD, R78E05-p65AD). (J and K) Rolling behavior of larvae bearing split-GAL4 > UAS-TnT to a 40 °C-heat probe, at 24 h after UVC. (L and M) Thermogenetics stimulation of larvae bearing split-GAL4 > UAS-TrpA1-A (L) or R74A06-GAL4 > UAS-TrpA1-A (M) by a 40 °C heat probe did not induce rolling behavior. (N) Representative heat responses of BLA neurons from larvae bearing R21G01-GAL4 > UAS-GCaMP6s, at 24 h after mock or UVC treatment. A diagram for BLA and VLT neurons in larval CNS, labeled by R21G01-GAL4 is displayed, Left. Squared area (25 μm × 25 μm) including the cell body of BLA neurons is enlarged (Right) to show somatic heat responses. Dissected larval brains were stimulated using a program-controlled heat block. (O and P) Summary results of peak heat responses of BLA neurons from wild-type (O) and TrpA1-KO (P) larvae. Larvae were mock or UVC-treated 24 h before imaging. Genotypes used for GCaMP imaging are: wt (w; UAS-GCaMP6s/+; R21G01-GAL4/+). KO (w; UAS-GCaMP6s/+; R21G01-GAL4, TrpA1-KO/TrpA1-KO). For A–D, G and H, and J–M, the sample numbers are indicated with brackets. Log-rank tests were performed and corrected by total comparing group numbers. Results of statistical analysis are marked in the corresponding bar graphs for clarity, and columns with different superscripts (a and b) are significantly different from each other (P < 0.05). ns, no significant difference (P > 0.05). For F, Fisher’s exact test was performed. For O and P, unpaired Student’s t tests were performed. *P < 0.05, ns, no significant difference.

