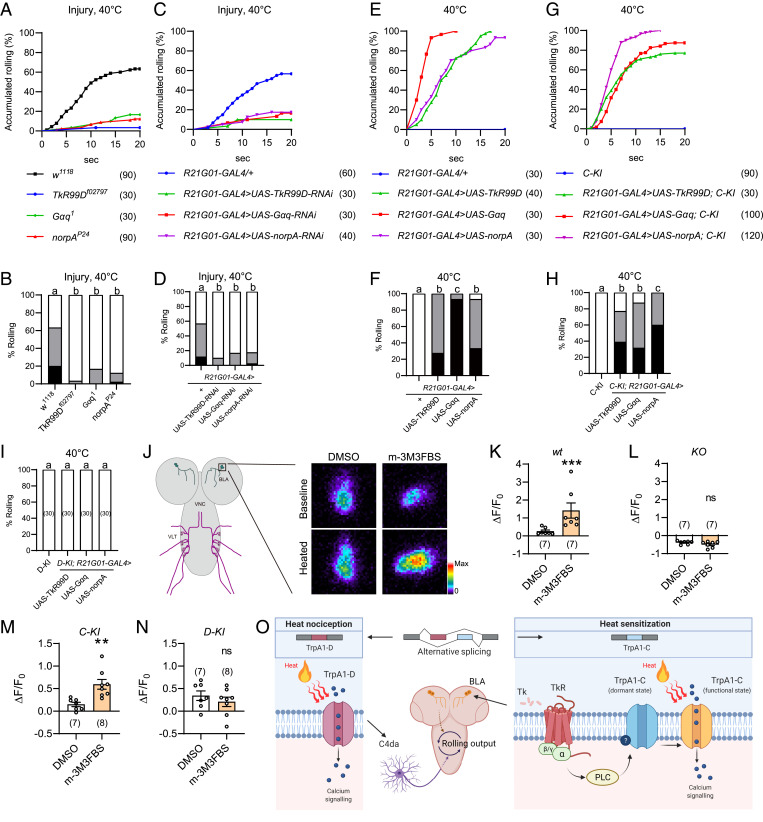
Fig. 4.
Gq-PLC signaling modulates heat responses of TrpA1-C but not TrpA1-D. (A and B) Injury-induced heat allodynia was impaired in larvae bearing genetic mutation of TkR, Gq, or PLC. Behavioral assay was performed 24 h after UVC treatment. (C and D) Injury-induced heat allodynia was impaired in larvae in which TkR, Gq, or PLC was knocked down in BLA neurons. Behavioral assay was performed 24 h after UVC treatment. (E and F) Heat allodynia was induced in wild-type larvae in which TkR, Gq or PLC was overexpressed in BLA neurons, in the absence of tissue injury. (G and H) Heat allodynia was induced in TrpA1-C-KI larvae in which TkR, Gq, or PLC was overexpressed in BLA neurons, in the absence of tissue injury. (I) No heat allodynia was induced in TrpA1-D-KI larvae in which TkR, Gq, or PLC was overexpressed in BLA neurons, in the absence of tissue injury. (J) Representative somatic heat responses of wild-type BLA neurons, in the presence of DMSO or the PLC agonist m-3M3FBS (20 μM). Larvae bearing R21G01-GAL4 > UAS-GCaMP6s were used, in the absence of tissue injury. A diagram for BLA and VLT neurons in CNS is displayed (Left), and BLA cell body is enlarged (Right) to show somatic heat responses. (K–N) Summary results of peak heat responses of BLA neurons from wild-type (K), TrpA1-KO (L), TrpA1-C-KI (M), and TrpA1-D-KI (N) larvae. Their genotypes are: wt (w; UAS-GCaMP6s/+; R21G01-GAL4/+), KO (w; UAS-GCaMP6s/+; R21G01-GAL4, TrpA1-KO/TrpA1-KO), C-KI (w; R21G01-lexA/lexAop2-myr-GCaMP6s; TrpA1-C-KI/TrpA1-C-KI), and D-KI (w; R21G01-lexA/lexAop2-myr-GCaMP6s; TrpA1-D-KI/TrpA1-D-KI). (O) A working model showing two distinct transduction mechanisms regulate acute heat nociception and allodynia. Nociception is mediated by TrpA1-D in peripheral C4da neurons, while allodynia by tissue injury is mediated by TrpA1-C in brain BLA neurons. Tachykinin receptor/G protein/PLC cascades specifically sensitize TrpA1-C by switching it from a dormant to a functional state. For A to I, the sample numbers are indicated with brackets. Log-rank test was performed and corrected by total comparing group numbers. Results of statistical analysis are marked in the corresponding bar graphs, and columns with different superscripts (a, b, and c) are significantly different from each other (P < 0.05). ns, no significant difference (P > 0.05). For K, Mann–Whitney U test was performed. ***P < 0.001. For L–N, unpaired Student’s t tests were performed. *P < 0.05, **P < 0.01.

