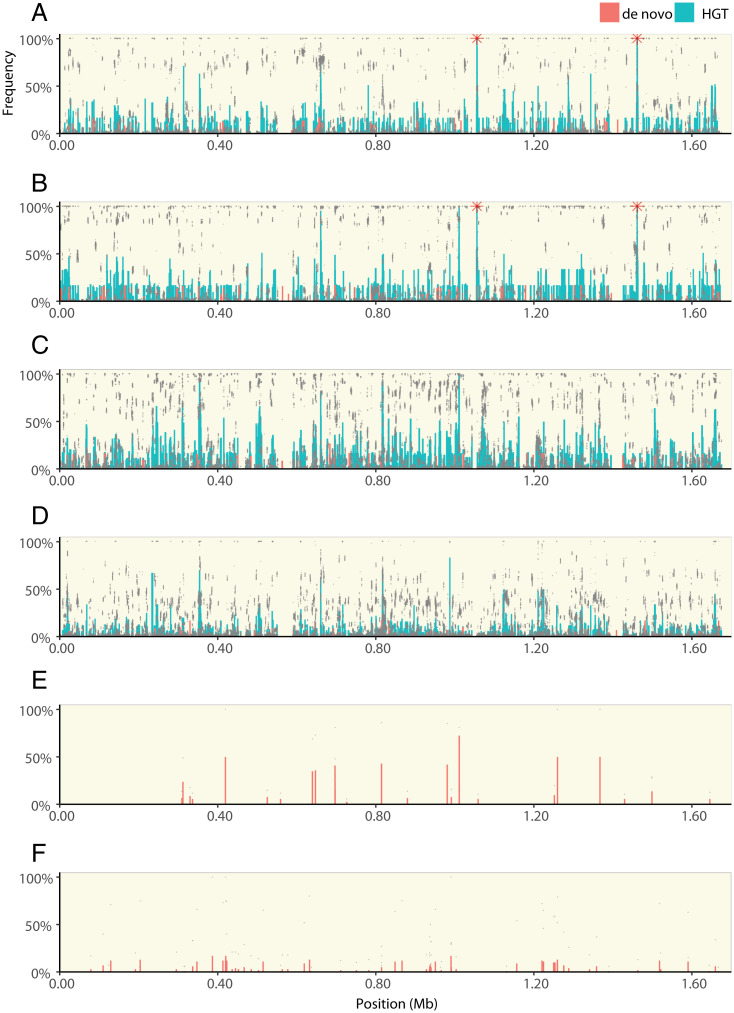
Fig. 3.
The distribution of HGT and de novo variants across the H. pylori genome. Each panel shows the frequency of genetic variants along the length of the H. pylori genome. Populations evolving with HGT from the CH428 donor in growth media with clarithromycin and metronidazole (A), clarithromycin (B), metronidazole (C), or in growth media without antibiotic (D). Populations evolving without HGT, including the two populations that survived treatment with metronidazole (E) and populations that evolved in growth media without antibiotic (F). Each panel (except E) shows sequencing data from six replicate populations, including data points from each individual population (gray dots), the average frequency of each HGT (green bars), and de novo (red bars) genetic variant. Red stars indicate 23S rRNA mutations. Data from populations that evolved with HGT from CH426 are shown in SI Appendix, Fig. S3.

