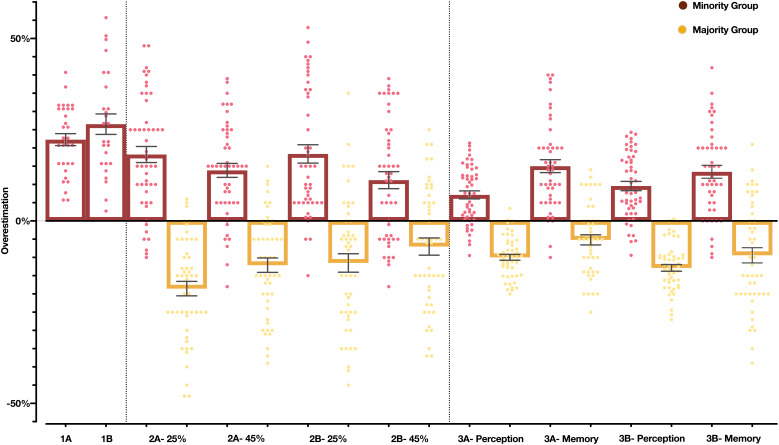
Fig. 2.
The results of Experiments 1A to 3B. Zero denotes accurate estimates, positive values denote overestimation, and negative values underestimation. In Experiments 1A and 1B, the participants estimated the percentage of Arab students at the Hebrew University. In Experiment 2, the participants estimated the percentage of Black American faces (red) and White American faces (yellow) from memory in two conditions; overall prevalence is 25 or 45%. In Experiment 3, the participants estimated the percentage of Black American faces and White American faces in perception and memory. The participants in Experiments 1A, 2A, and 3A belong to the majority group (Jewish Israelis or White Americans). The participants in Experiments 1B, 2B, and 3B belong to the minority groups (Palestinian Israelis or Black Americans). Overall, 82.1% of participants overestimated the percentage of the minority group.

