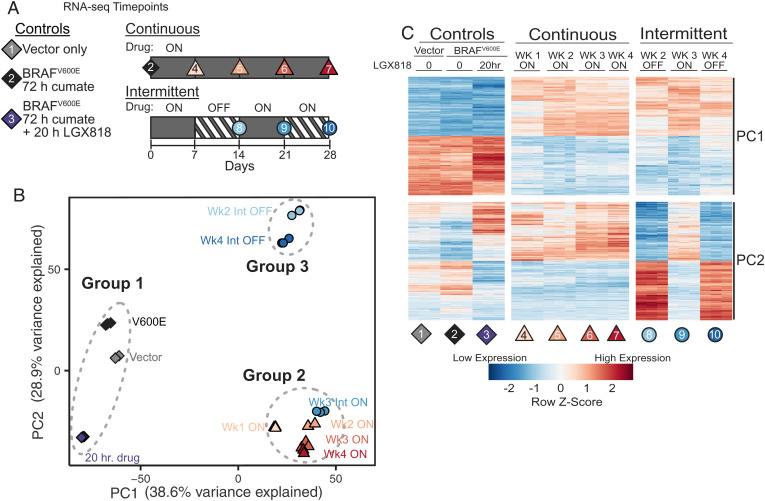
Fig. 4.
Transcriptomic profiling of continuously and intermittently treated cells. (A) Schematic of RNA samples collected from WM239A-BRAFV600E cells comparing continuous and intermittent drug treatment with 500 nM LGX818. Each condition was collected in biological triplicates, except for week 4 continous (sample 7), which was collected in duplicates, for a total of 29 samples. (B) Principal component analysis (PCA) of the 6,000 highest variance genes. PC1 and PC2 account for almost 70% of the variance in these genes. The 10 different experimental conditions visibly cluster into three separate groups. (C) Heatmap of the 400 genes most positively or negatively associated with PC1 or PC2. Each row is mean centered and scaled to unit variance.

