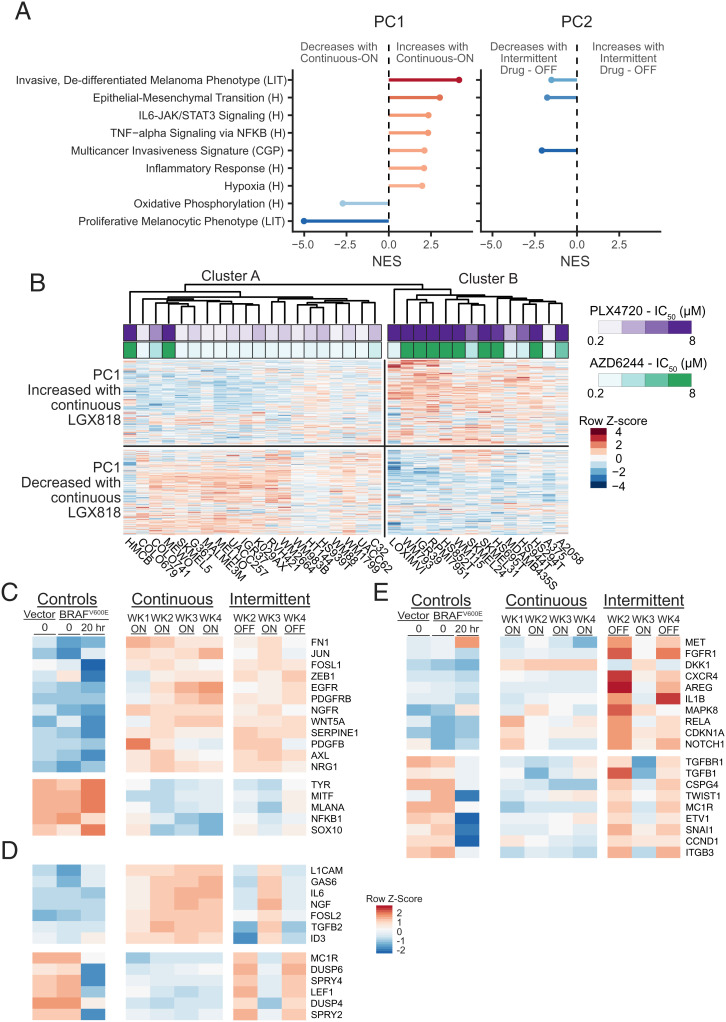
Fig. 5.
Reversible transcriptome changes are associated with EMT-like responses. (A) Gene set enrichment analysis (GSEA) was performed on genes associated with PC1 and PC2. The gene loadings for each PC were used as the ranks. Shown are the normalized enrichment scores (NESs) for selected gene sets matched to PC1 with significant false discovery rate (FDR)-adjusted P values (q < 0.002). The NESs for the same gene sets matched to PC2 are shown for cases where the FDR-adjusted P value is less than q < 0.05. Gene sets were from the Molecular Signature Database for Hallmark “H,” Chemical and Genetic Perturbations “CGP,” or derived from the literature “LIT.” (B) Clustered heatmap of RNA-seq data of BRAFV600 mutant melanomas in the CCLE. Only the 800 genes identified as PC1 associated in Fig. 4 are shown and used to cluster the cell lines. Cluster A mostly contained cell lines that were sensitive to the BRAF inhibitor, PLX4720, or the MEK inhibitor, AZD6244 (lower IC50). Cluster B mostly contained cell lines with greater resistance to either drug (higher IC50). The two clusters show differential expression of genes that either increased or decreased with continuous treatment in our RNA-seq dataset. (C–E) Heatmaps of RNA-seq data corresponding to literature-curated genes that have been implicated in melanoma drug resistance or sensitivity. (C) Known resistance genes that changed in response to continuous treatment and did not change with drug removal, predicting sustained resistance over the intermittent time course. (D) Resistance genes showing reversible expression between drug-on and drug-off weeks that changed in a manner predicting resensitization upon drug removal. (E) Resistance genes showing reversible expression between drug-on and drug-off weeks, but predicting higher resistance during weeks of drug removal in the intermittent time course.

