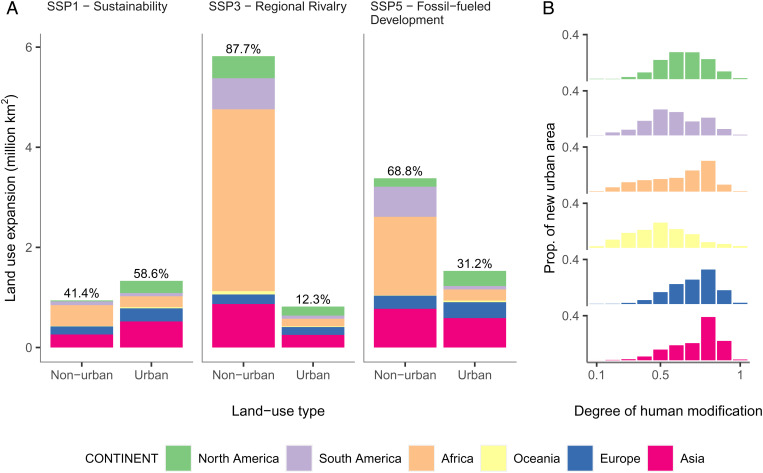
Fig. 1.
(A) Quantities of new urban and nonurban (pasture, crop, and forestry) land projected between 2015 and 2050 under three SSP scenarios. Stacked segments indicate the distribution of new urban and nonurban land across continents. The urban and nonurban percentages of total land-use change under each SSP are shown above bars. (B) The distribution of new urban land across the range of present-day human modification levels from 0 (not modified) to 1 (entirely modified), in increments of 0.1, across continents. Values are the mean proportion across the three SSP scenarios.

