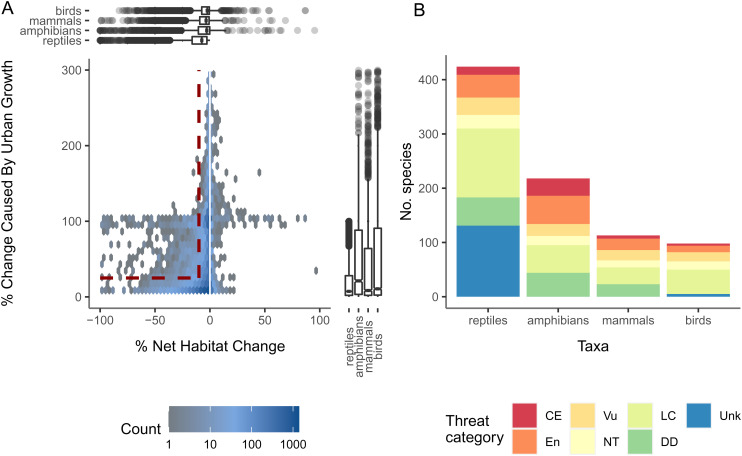
Fig. 3.
(A) Relative range loss due to urban vs. all anthropogenic land-cover change summarized for all terrestrial vertebrate species affected by urban land expansion under SSP1 (n = 21,111). Hexagons colors indicate species count, and marginal boxplots display the distribution by class. Species with HSR expansion > 100% (<0.1% of all) are not shown. Species for which urban expansion drives > 300% of net HSR change are not shown for clarity (2.5% of all). Red dashed lines in A indicate the lower thresholds for considering species as heavily impacted by urban growth (n = 855). (B) Species are summarized by class and IUCN Red List conservation status. CE = critically endangered, En = endangered, Vu = vulnerable, NT = near threatened, LC = least concern, DD = data deficient, Unk = unknown.

