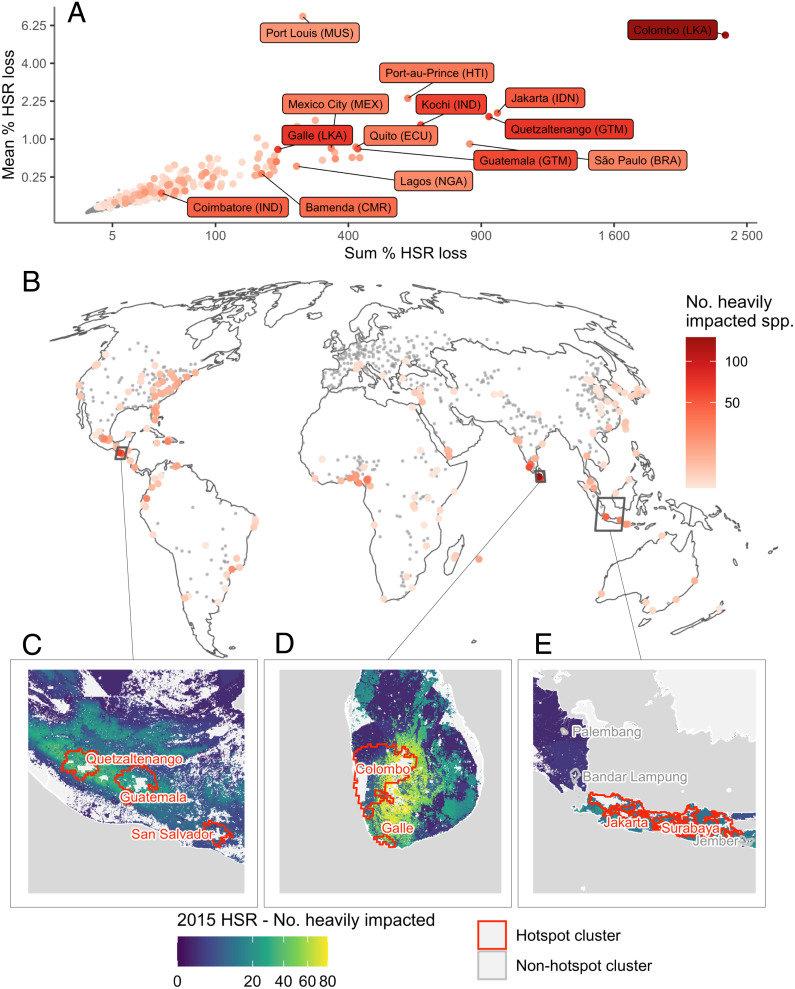
Fig. 4.
Urban impact hotspot clusters under SSP1. In A and B, the color of points indicates the number of heavily impacted species affected by an urban cluster. (A) The summed percentage of individual species’ 2015 HSR lost to urban expansion within each cluster (x axis) and the mean percentage of 2015 HSR lost to urban expansion across species affected by a cluster (y axis). (B) The geographic distribution of urban impact hotspot clusters. (C–E) Example regions. Background color shows the extent of 2015 HSR for species predicted to be heavily impacted in our analysis. Color represents species count. Boundaries of hotspot and nonhotspot urban clusters are shown. To explore urban impact hotspots, go to ref. 55. MUS = Mauritius; HTI = Haiti; LKA = Sri Lanka; MEX = Mexico; IND = India; IDN = Indonesia; ECU = Ecuador; GTM = Guatemala; BRA = Brazil; NGA = Nigeria; CMR = Cameroon.

