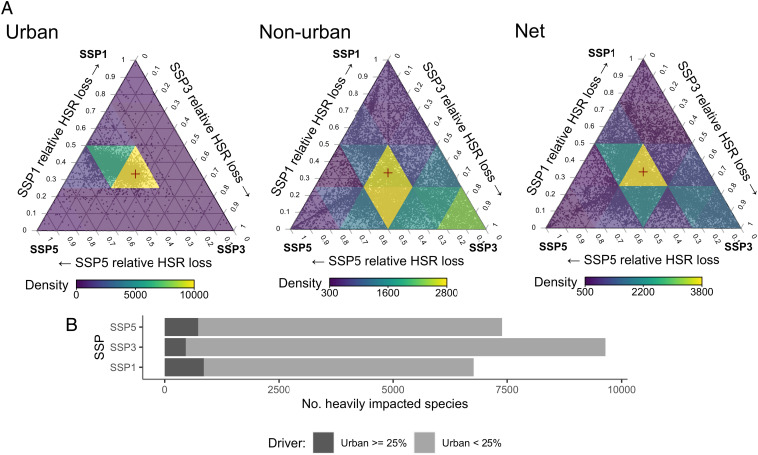
Fig. 5.
(A) For all species impacted by urban land expansion under at least one SSP (gray background points, n = 19,837), the relative HSR loss is shown across the three SSP scenarios driven by urban (Left), nonurban (pasture, crop, and forestry, Middle), and net (urban and nonurban, Right) land-use change. For each species, the relative HSR loss under a given SSP (SSPX) is a value 0–1, given by the HSR loss under SSPX expressed as a fraction of the summed HSR losses under all SSPs. For each species, the relative HSR losses under the three SSPs sum to 1. Species with similar HSR losses under each SSP are located in the center of the plot, marked by a red cross. The greater the relative habitat loss under a given SSP, the closer a species is located to the corresponding corner. Species located at the far corners lose habitat under one SSP only. Colored shading indicates density of points to display general trends. (B) Number of heavily impacted species by scenario. Length of bars indicates the number of species that lose ≥10% of 2015 HSR by 2050. Darker stacked segments indicate the proportion of these species for which urban land expansion drives ≥25% of this habitat loss.

