Fig. 3.
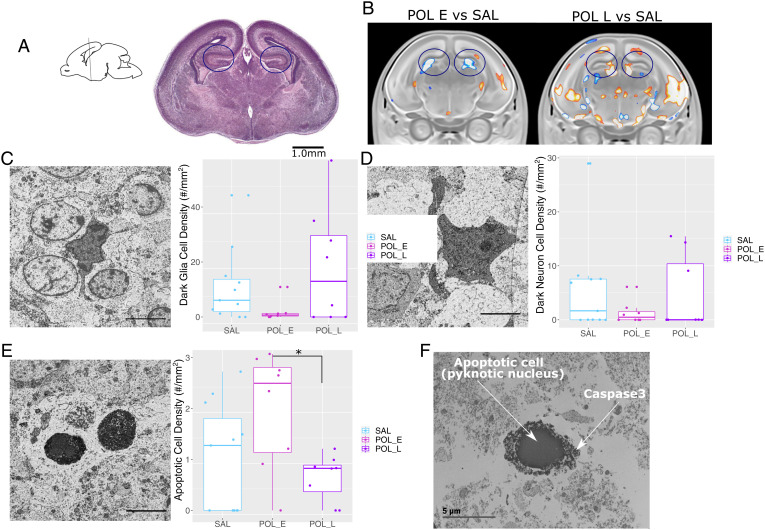
Differences in dark and apoptotic cell density with representative images captured using EM. (A) Sagittal slice orienting to the region of the hippocampus selected, with the corresponding brain slice stained with Cresyl Violet from the GD18 mouse brain atlas, coronal slice 14 (75). (Scale bar: 1 mm.) The region of interest is highlighted in the circles. (B) Representative slices of the hippocampus from the MRI results for POL E relative to SAL and POL L relative to SAL. The region of interest is highlighted in the circles. (C) Image acquired by scanning EM (25-nm resolution) in the dorsal hippocampus from representative offspring (equivalent to coronal slice 14 from A) highlighting dark glial cells. Boxplot showing dark glial cell density (per mouse) per group (n = 6 to 8 per group). (D) Representative dark neuron image with boxplot for dark neuron cell density per mouse. (E) Representative apoptotic cell image with boxplot for apoptotic cell density per mouse. (F) Representative apoptotic cell (with pyknotic nucleus), with positive active Caspase 3 staining surrounding the nucleus (black matter surrounding the nucleus). (Scale bars: 5 µm.) *P = 0.053.

