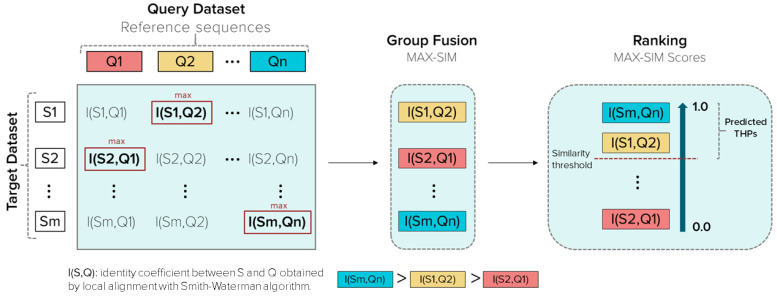
Figure 2.
Schematic representation of the group fusion and similarity searching processes. Q is a peptide from a query dataset, n is the number of peptides contained in a query dataset, S is a peptide from the target dataset (Main, Small, or Main90 dataset), m is the number of peptides included in the target dataset (1302, 938, or 619, respectively). The similarity threshold is related to the percentage of identity.

