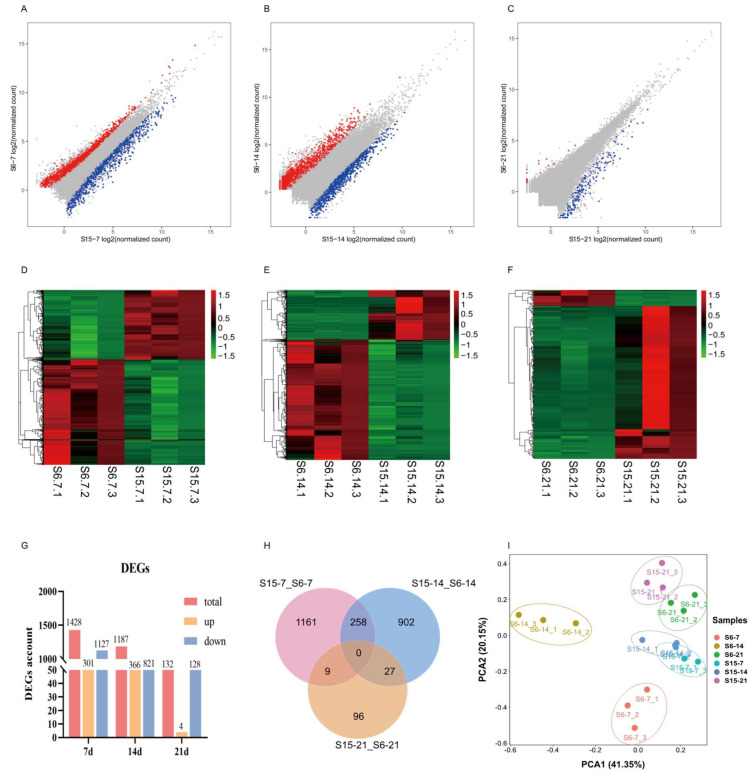
Figure 2.
Effects of hypotonic stress at different development stages of M. rosenbergii post-larvae on gene expression. Note: (A–C): the scatter plots showed the differences of gene expression of hypotonic stress in 7, 14, 21 day-post-hatch larvae, respectively; Red represents upregulated genes, blue represents downregulated genes; (D–F): the heatmap showed differential gene expression of hypotonic stress in 7, 14, 21 day-post-hatch larvae, respectively; Red represents upregulated genes, green represents downregulated genes; (G): the histogram showed the counts of different expression genes in different group; (H): Venn diagram comparing the expression distribution of different expression genes; (I): Principal component analysis (PCA) for the correlation among samples in different group. S6-7: 7 day-post-hatch larvae in 6 psu salinity; S15-7: 7 day-post-hatch larvae in 15 psu salinity; S6-14: 14 day-post-hatch larvae in 6 psu salinity; S15-14: 14 day-post-hatch larvae in 15 psu salinity; S6-21: 21 day-post-hatch larvae in 6 psu salinity; S15-21: 21 day-post-hatch larvae in 15 psu salinity.

