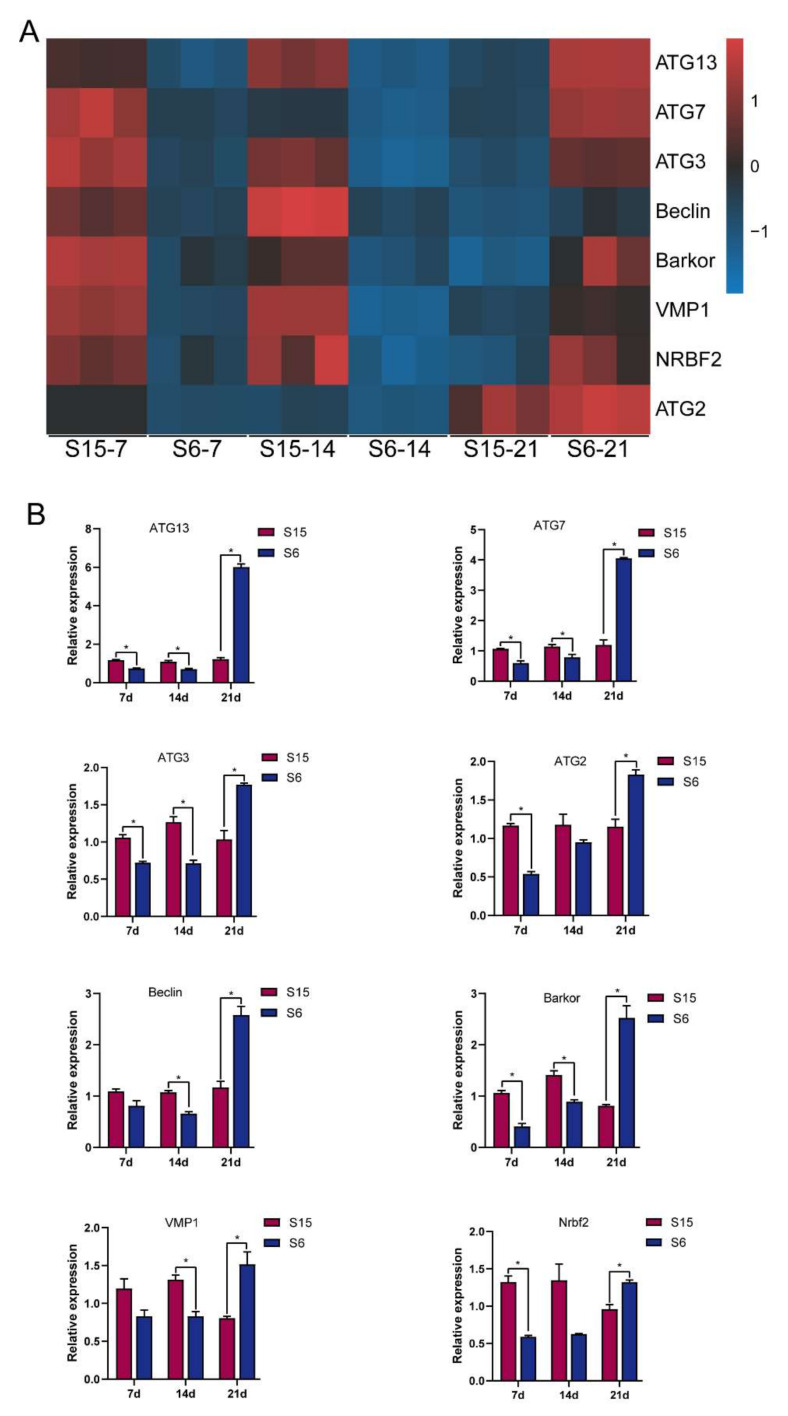
Figure 5.
Relative levels of autophagy signaling based on transcriptome analysis and qPCR validated. Note: (A): heatmap of relative levels of key genes of autophagy signaling retrieved from RNA-seq database; (B): relative transcripts levels (qPCR validation) of autophagy signaling key genes, β-actin was used as an internal control. * p < 0.05.

