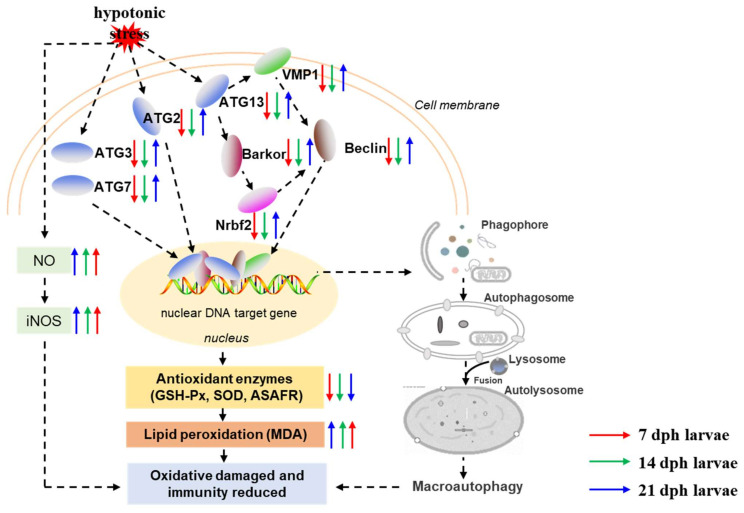
Figure 7.
Schematic diagram depicting the effects and possible mechanisms of hypotonic stress on antioxidant, immune capacity and autophagy related genes expression. Notes: The red arrow is representative of 7 dph larvae, green arrow is representative of 14 dph larvae, and blue arrow is representative of 21 dph larvae under hypotonic stress compare with normal salinity group; The upward arrow is representative of gene expression activation and the downward arrow is inhibition of gene expression.

