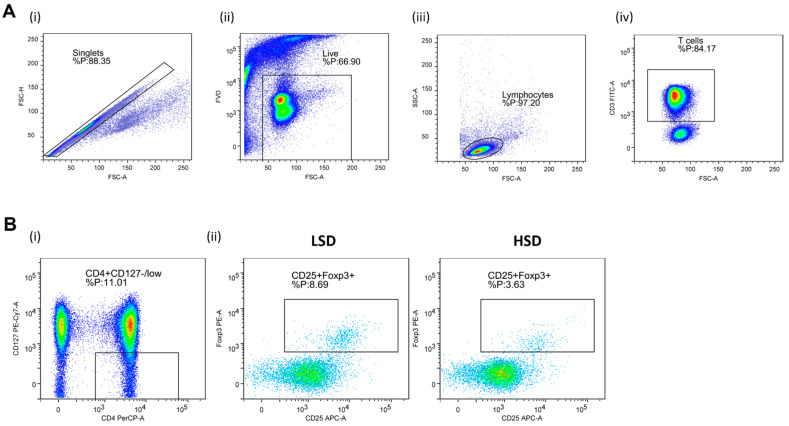
Figure 1.
Gating strategy for the assessment of peripheral blood regulatory T cells (Treg) by flow cytometry. Panel (A) shows representative dot plots illustrating gating strategy, including exclusion of doublets using forward scatter area (FSC-A) versus forward scatter width (FSC-W) analysis (A-i), gating on live cells negative for aminereactive fixable viability dye (A-ii), lymphocytes (A-iii), and CD3+ T cells (A-iv). Next, total CD25 and Foxp3, expressing T cells among CD4+CD127 low population, were analyzed (Panel (B)). (B-i) shows representative gating strategy, (B-ii) representative samples from LS and HS protocol. FlowLogic software was used for data analysis and illustration.

