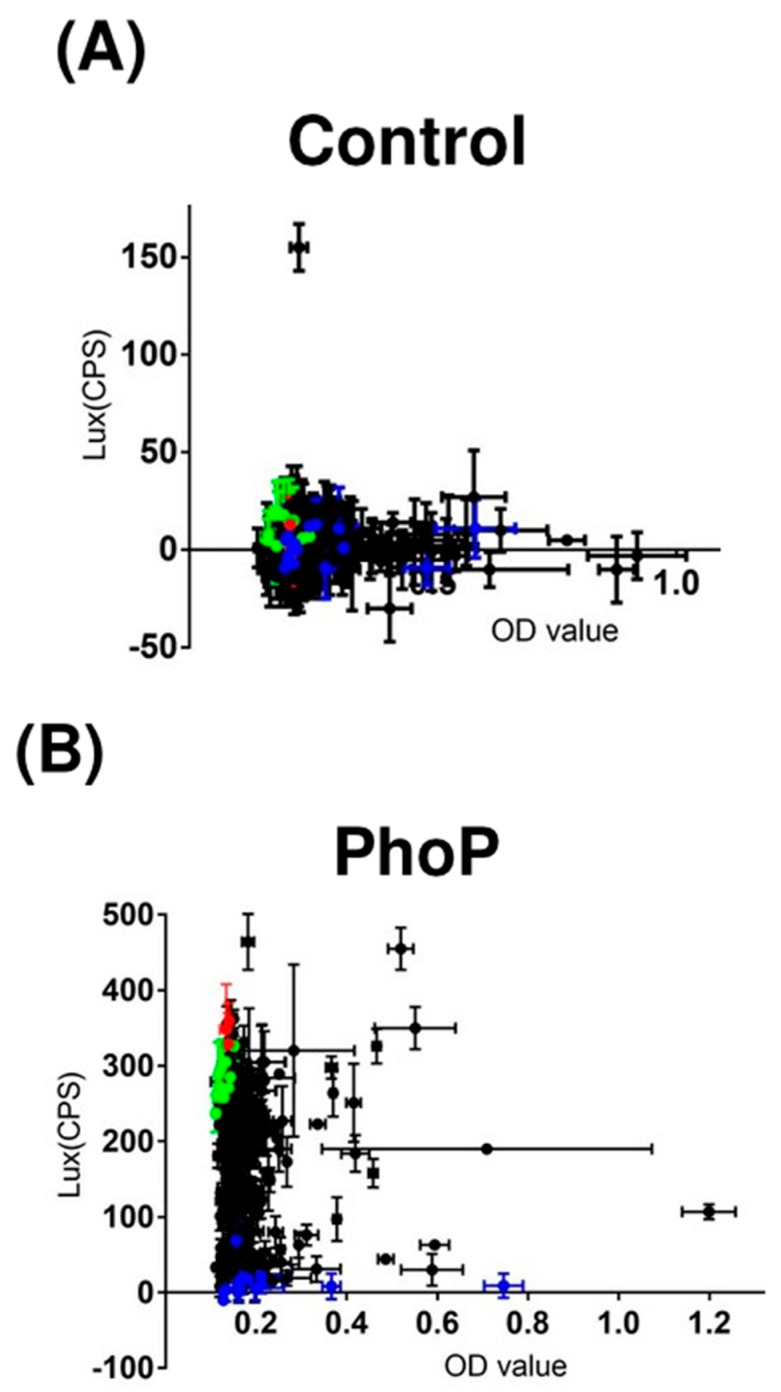
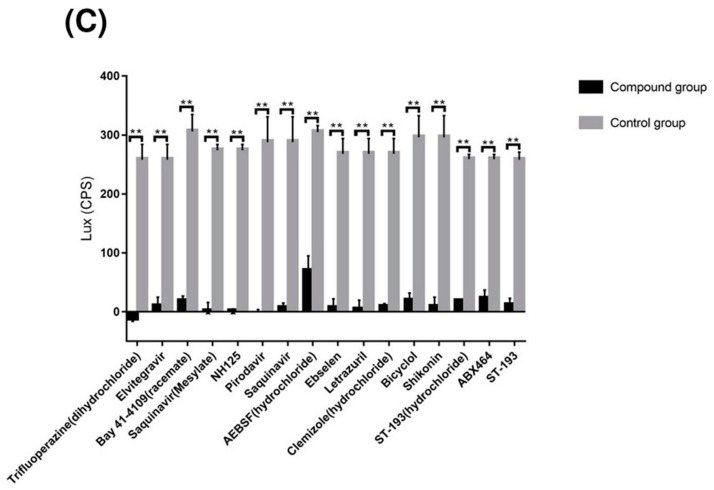
Figure 2.
Screening of 320 antiviral compounds and 3 anti-TB drugs. (A) OD600 and LUX of all samples with/without 4 h compound treatment in negative control platform of M. bovis BCG. (B) OD600 and LUX of all samples in the phoP promoter-reporter platform. Green dots represent BCG samples (including pMV306Adaptor+Lux) without any compound treatment. Red dots represent samples treated with the three anti-TB drugs. Blue dots represent samples treated with the 16 selected compounds, while black dots represent samples treated with other compounds. (C) Comparison of lux signals between the compound treatment and control samples. ** p < 0.01.


