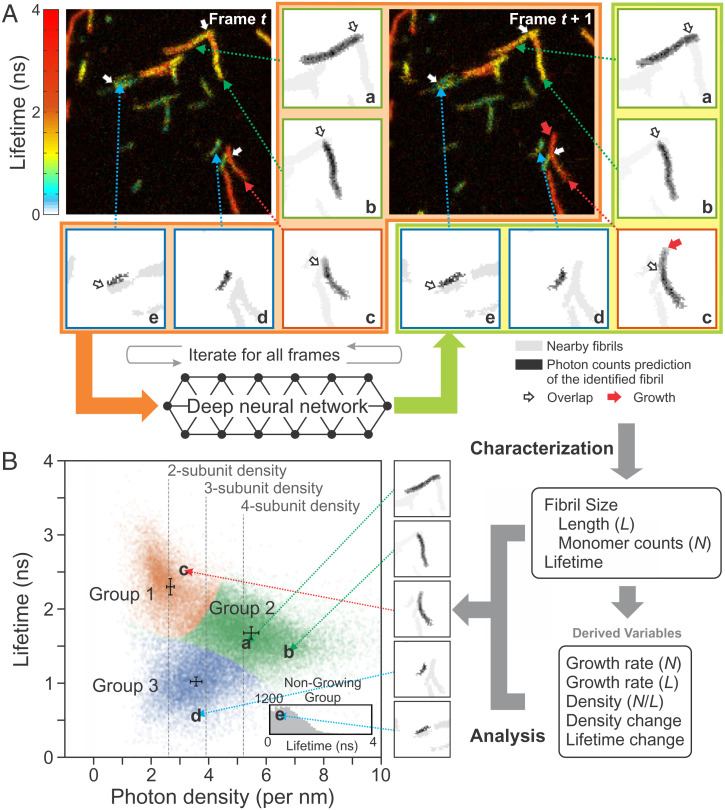
Fig. 3.
Flowchart of individual fibril analysis. (A) Identification and separation of individual fibrils using FNet. Individual fibril images of frame t and the new image of frame t + 1 are processed in FNet (images inside the orange area), which results in the updated individual fibril images (inside the yellowish-green area) and new fibrils. The procedure is repeated for the entire time series of images of the same region. Five individual fibrils a through e with different characteristics are shown in the subregions on the right and bottom sides of the image as examples. Each subregion consists of only one fibril (black), but nearby fibrils (gray) are also shown for comparison. Red, green, and blue squares of the subregion indicate fibril groups 1, 2, and 3 in B, respectively. White arrows indicate the overlapping regions of fibrils before separation. Red arrow in the subregion of fibril c at t + 1 indicates the growth of a fibril. (B, Right) After separation, fibrils in each image are characterized by various properties: length (L) measured on the fibril image, fluorescence lifetime, and size in terms of the number of monomers (N), which is calculated using the fluorescence intensity and lifetime. Using these parameters, other time-dependent variables are extracted: growth rate in terms of the length and size (number of monomers) and changes of the monomer density and lifetime of fibrils. (B, Left) Using the variables from these characterizations, a 2D plot of fluorescence lifetime vs. photon density (number of photons per unit length) is constructed. The distribution of individual fibrils with a measurable length (i.e., twice larger than the PSF size) are clustered into three groups (three different colors). The error bars located at the center of each cluster indicate the shot noise (SD) of the density and lifetime determined from the smallest number of photons of the fibrils in the experiment (412, 436, and 323 photons for groups 1, 2, and 3). The much smaller error compared to the width of the distribution of all three groups may indicate additional fibril heterogeneity. Nongrowing fibrils (SI Appendix, SI Text for the definition) are characterized only by the fluorescence lifetime (Inset). Letters a through e and arrows indicate the locations of the five fibrils in the plot.

