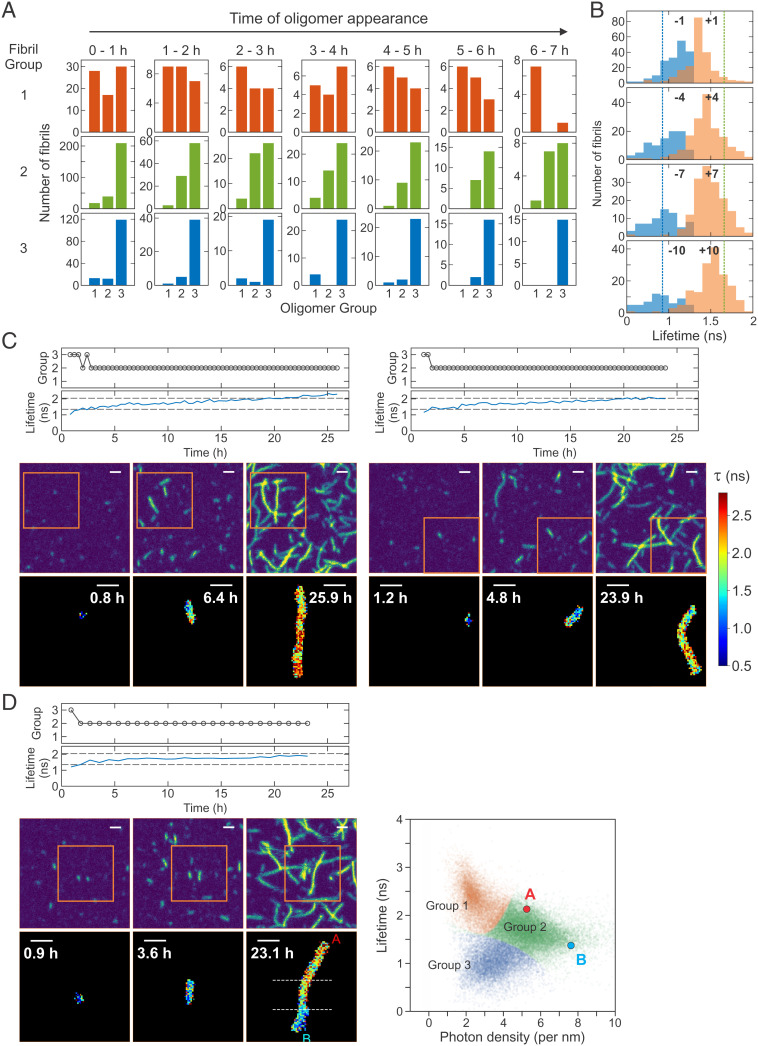
Fig. 5.
Heterogeneous secondary nucleation from oligomers. (A) Oligomer origin of the three fibril groups (three columns). The growth of individual fibrils of the three groups was backtracked to identify the group of oligomers or short fibrils (<500 nm) at their appearance during the time period of 0 to 7 h. The majority of group 3 fibrils originate from the oligomers of their own group, whereas the majority of group 2 fibrils originate from group 3 oligomers when they appear at the beginning of aggregation (0 to 1 h). The origin of group 1 fibrils is more diverse at the early stage of aggregation, which gradually converges to group 1 oligomers at later times. (B) The distributions of fluorescence lifetimes of fibrils before (blue) and after (orange) the transition from group 3 to group 2 at different frame separations from the transition interval: ±1 to ±10 frames. Vertical dashed lines show the average fluorescence lifetimes of group 2 (green) and group 3 (blue) fibrils. (C) Time-dependent changes of the fibril group and average fluorescence lifetime of individual fibrils and snapshot images of two fibrils exhibiting heterogeneous secondary nucleation (group 3 → 2). See Movies S9 and S10 for these fibrils and additional examples in SI Appendix, Fig. S11D and Movies S11 and S12. (D) Example of fibrils that grow both directions with different lifetimes. The fibril grows from a group 3 oligomer. In the last frame (23.1 h) upper (red A, above the upper horizonal dashed line) and lower (cyan B, below the lower dashed line) parts of the fibril show distinct density and fluorescence lifetimes as shown in the 2D plot on the right side (double heterogeneous secondary nucleation). See Movie S13 and more examples in SI Appendix, Fig. S12 and Movies S14–S18. (C and D) Horizontal dashed lines in the lifetime trajectories indicate the lifetime criteria for the separation of the oligomer groups (1.35 ns and 2.04 ns). Note that the fibril density is also used for the fibrils of measurable size at later stages of aggregation. Upper image panels are fluorescence intensity images of a 10- × 10-μm2 area at three different time points. Lower panels are fluorescence lifetime images (5 × 5 μm2) of single fibrils inside the orange square in the corresponding intensity images. (Scale bars: 1 μm.)

