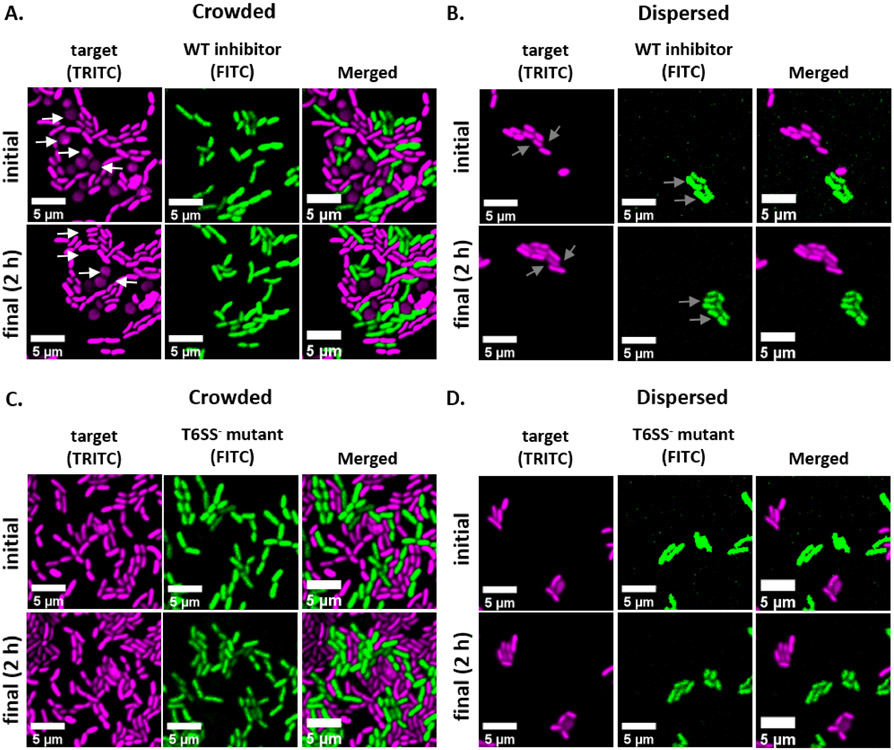
Figure 2: Time lapse images of coincubation spots in either crowded or disperse conditions.
(A) Representative images at initial and final time points where a mixed culture of target and wild-type inhibitor was concentrated 3x prior to spotting on the slide to force cell-cell contact between strains. White arrows in TRITC channel indicate examples of target cells that round or lyse throughout the course of the experiment. (B) Representative images where a mixed culture of target and wild-type inhibitor was spotted without concentrating so that cells are disperse and there is minimal cell-cell contact between strains. Gray arrows in FITC and TRITC channels indicate examples of cell division throughout the course of the experiment. (C) Representative images where mixed culture of target and T6SS− mutant was concentrated 3x prior to spotting on the slide to force cell-cell contact between strains. (D) Representative images where mixed culture of target and T6SS− mutant was spotted without concentrating so that cells are disperse and there is minimal cell-cell contact between strains. Scale bars = 5 μm and are consistent across all images; TRITC channel is false-colored magenta, FITC channel is false-colored green. Deconvolution was performed on all images; background was subtracted, and brightness/contrast adjusted uniformly across all images.

