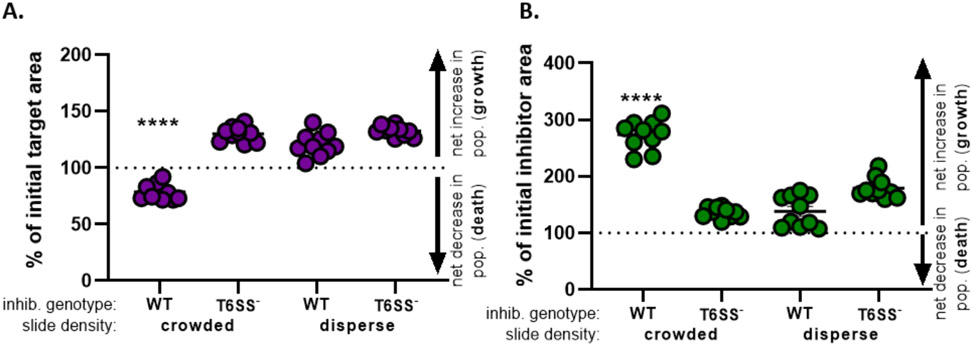
Figure 4: Sample data for assessing whether target strain is inhibited.
The percent of initial area at the final time points for the target strain (A) and inhibitor strain (B), at different initial cell densities. Slide density indicates either a starting cell density that is crowded (high cell contact between strains), or more disperse (low cell contact between strains) as described in Figure 2. Inhibitor genotype indicates that either a wild-type or the T6SS mutant (T6SS−) strain was coincubated with the target strain. Asterisks indicate a significant difference in % change comparing all treatments (one-way ANOVA followed by a Tukey's multiple comparisons test comparing all treatments; (p < 0.0001). Dashed line indicates no net change in strain area between the initial and final timepoint; a % change > 100 indicates net increase (i.e., growth) and % change < 100 indicates net decrease (i.e., cell death).

