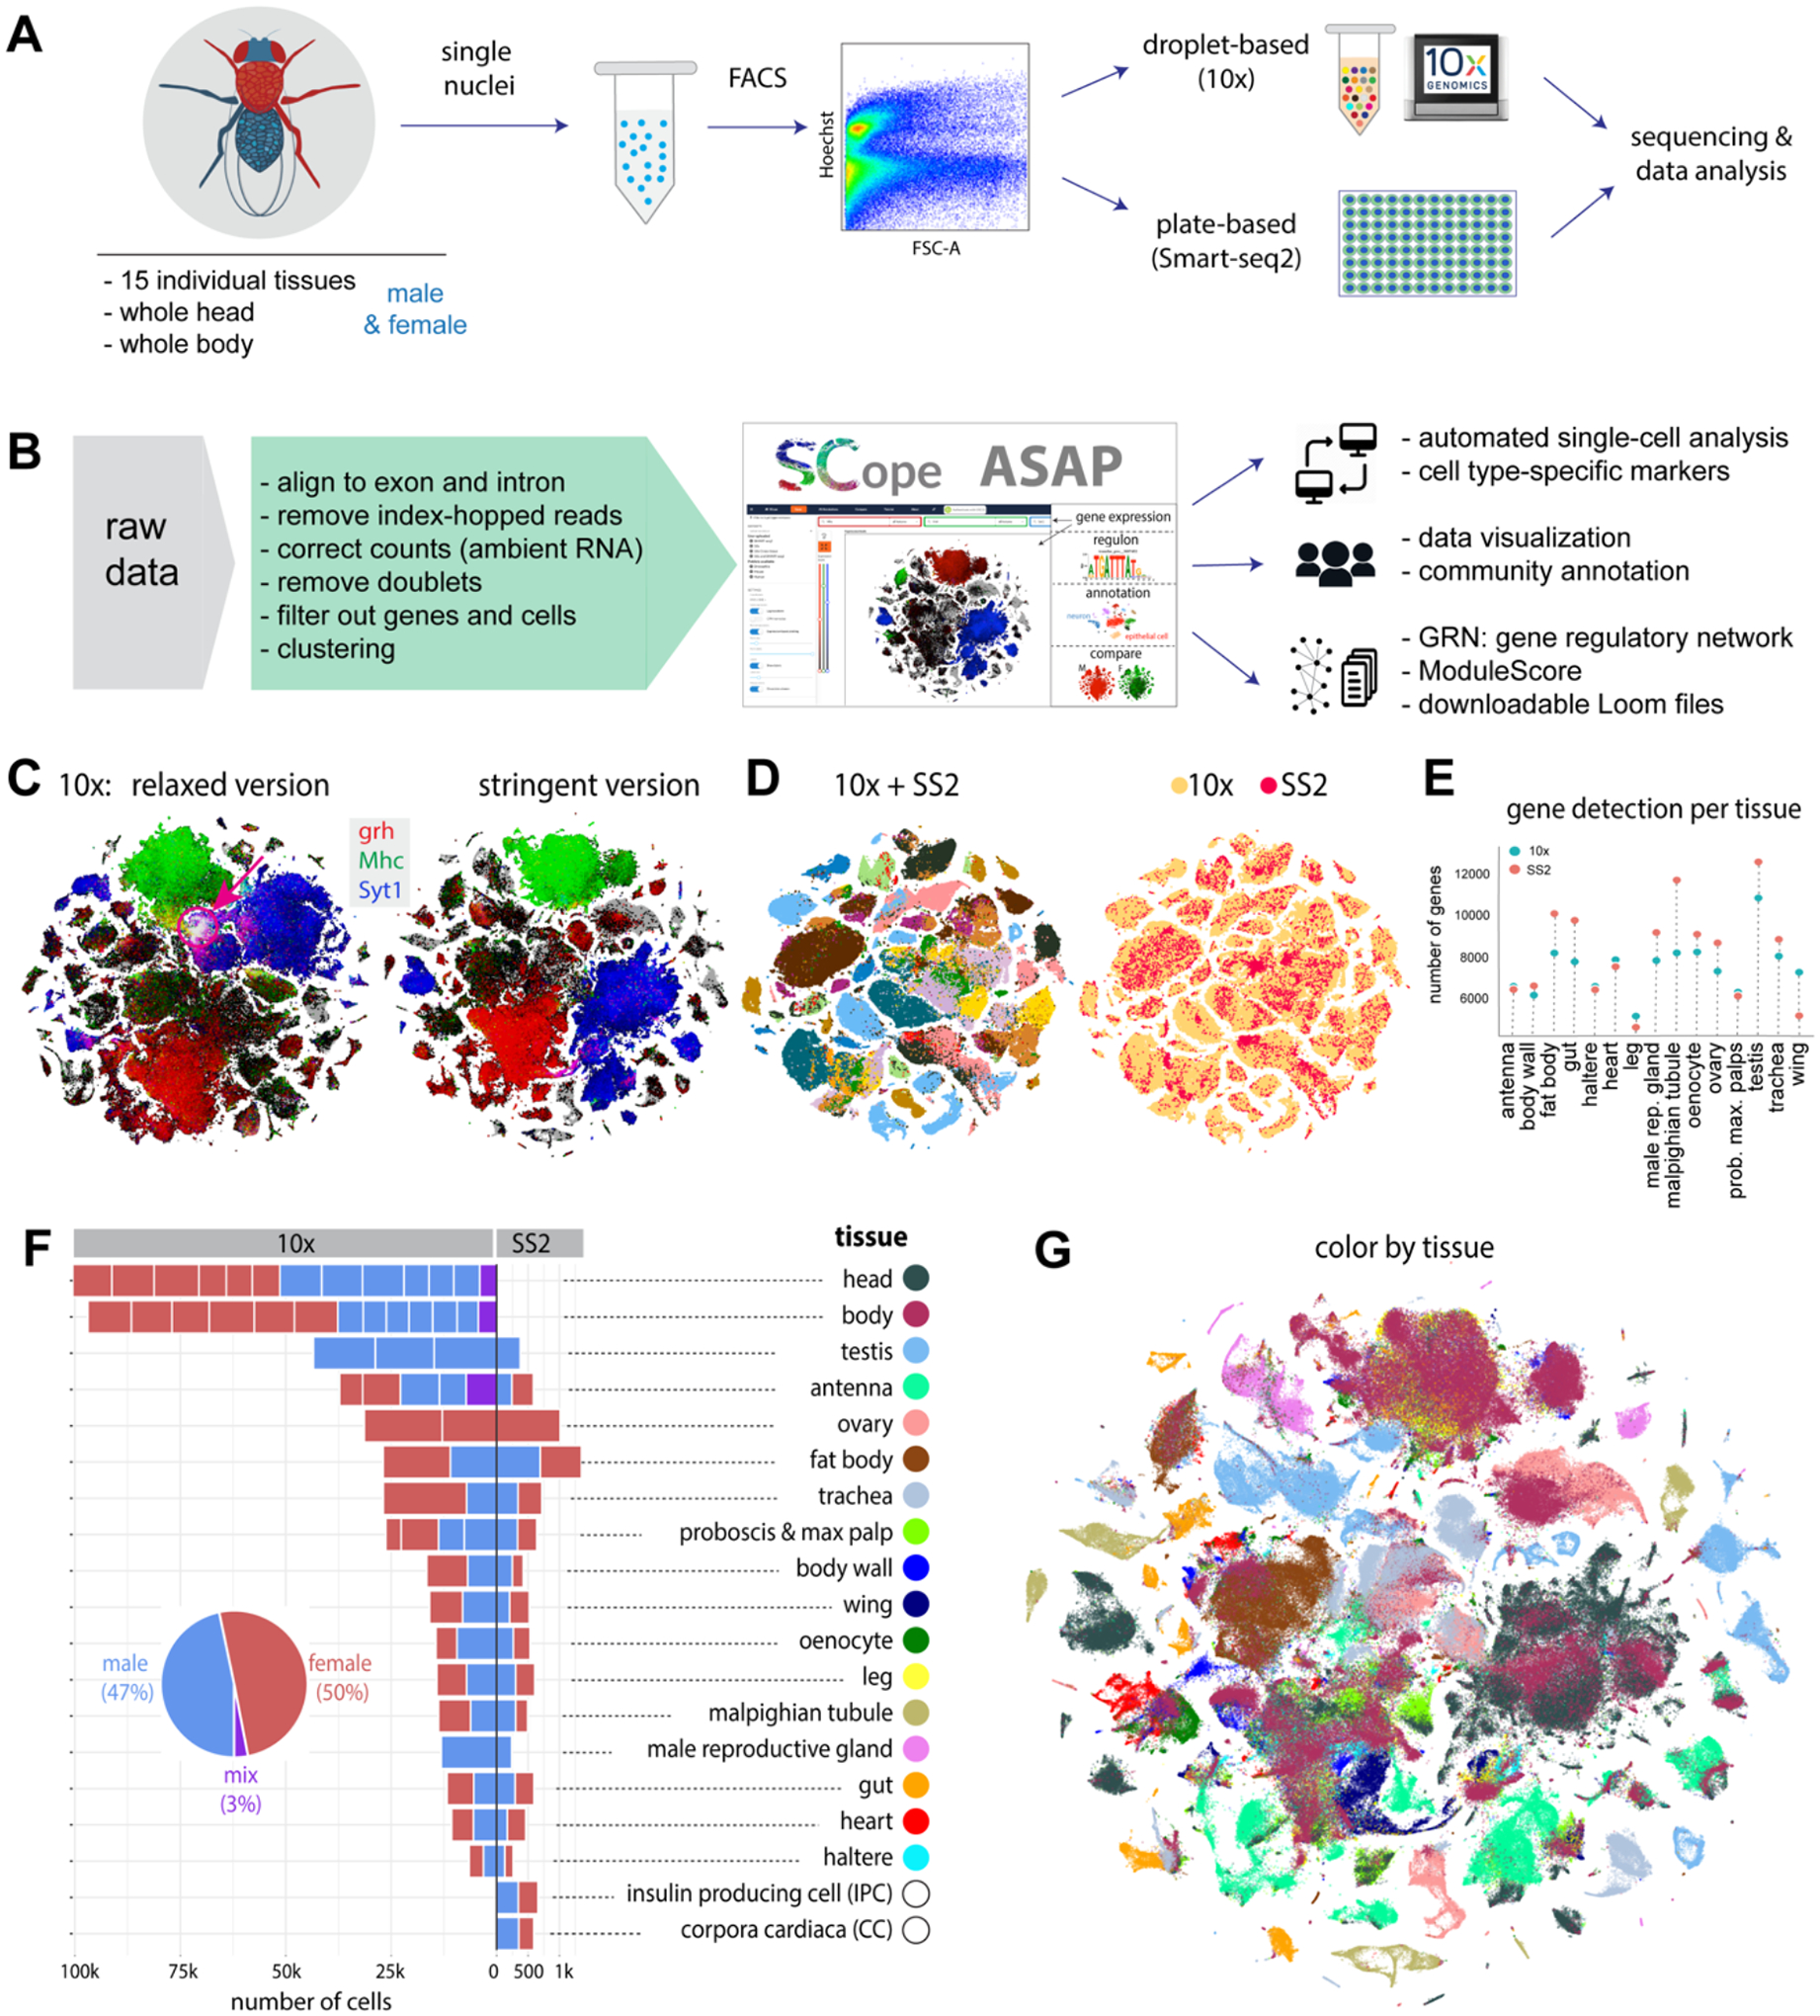
Figure 1. Overview of the Fly Cell Atlas.

(A) Experimental platform of snRNA-seq using 10x Genomics and Smart-seq2 (SS2).
(B) Data analysis pipeline and data visualization using SCope (17) and ASAP (18).
(C) Two versions of 10x datasets: Relaxed and Stringent. tSNE colors based on gene expression: grh (epithelia, red), Mhc (muscle, green) and Syt1 (neuron, blue). Red arrow denotes an artefactual cluster with co-expression of all three markers in the Relaxed dataset.
(D) tSNE visualization of cells from the Stringent 10x dataset and Smart-seq2 (SS2) cells. 10x cells are from individual tissues. Integrated data is colored by tissue (left) and platform (right).
(E) Tissue-level comparison of the number of detected genes between 10x and Smart-seq2 platforms.
(F) Number of cells for each tissue by 10x and Smart-seq2. Male and female cells are indicated. Mixed cells are from pilot experiments where flies were not sexed. Different batches are separated by vertical white lines.
(G) All 10x cells from the Stringent dataset clustered together; cells are colored by tissue type. Tissue names and colors are indexed in F.
