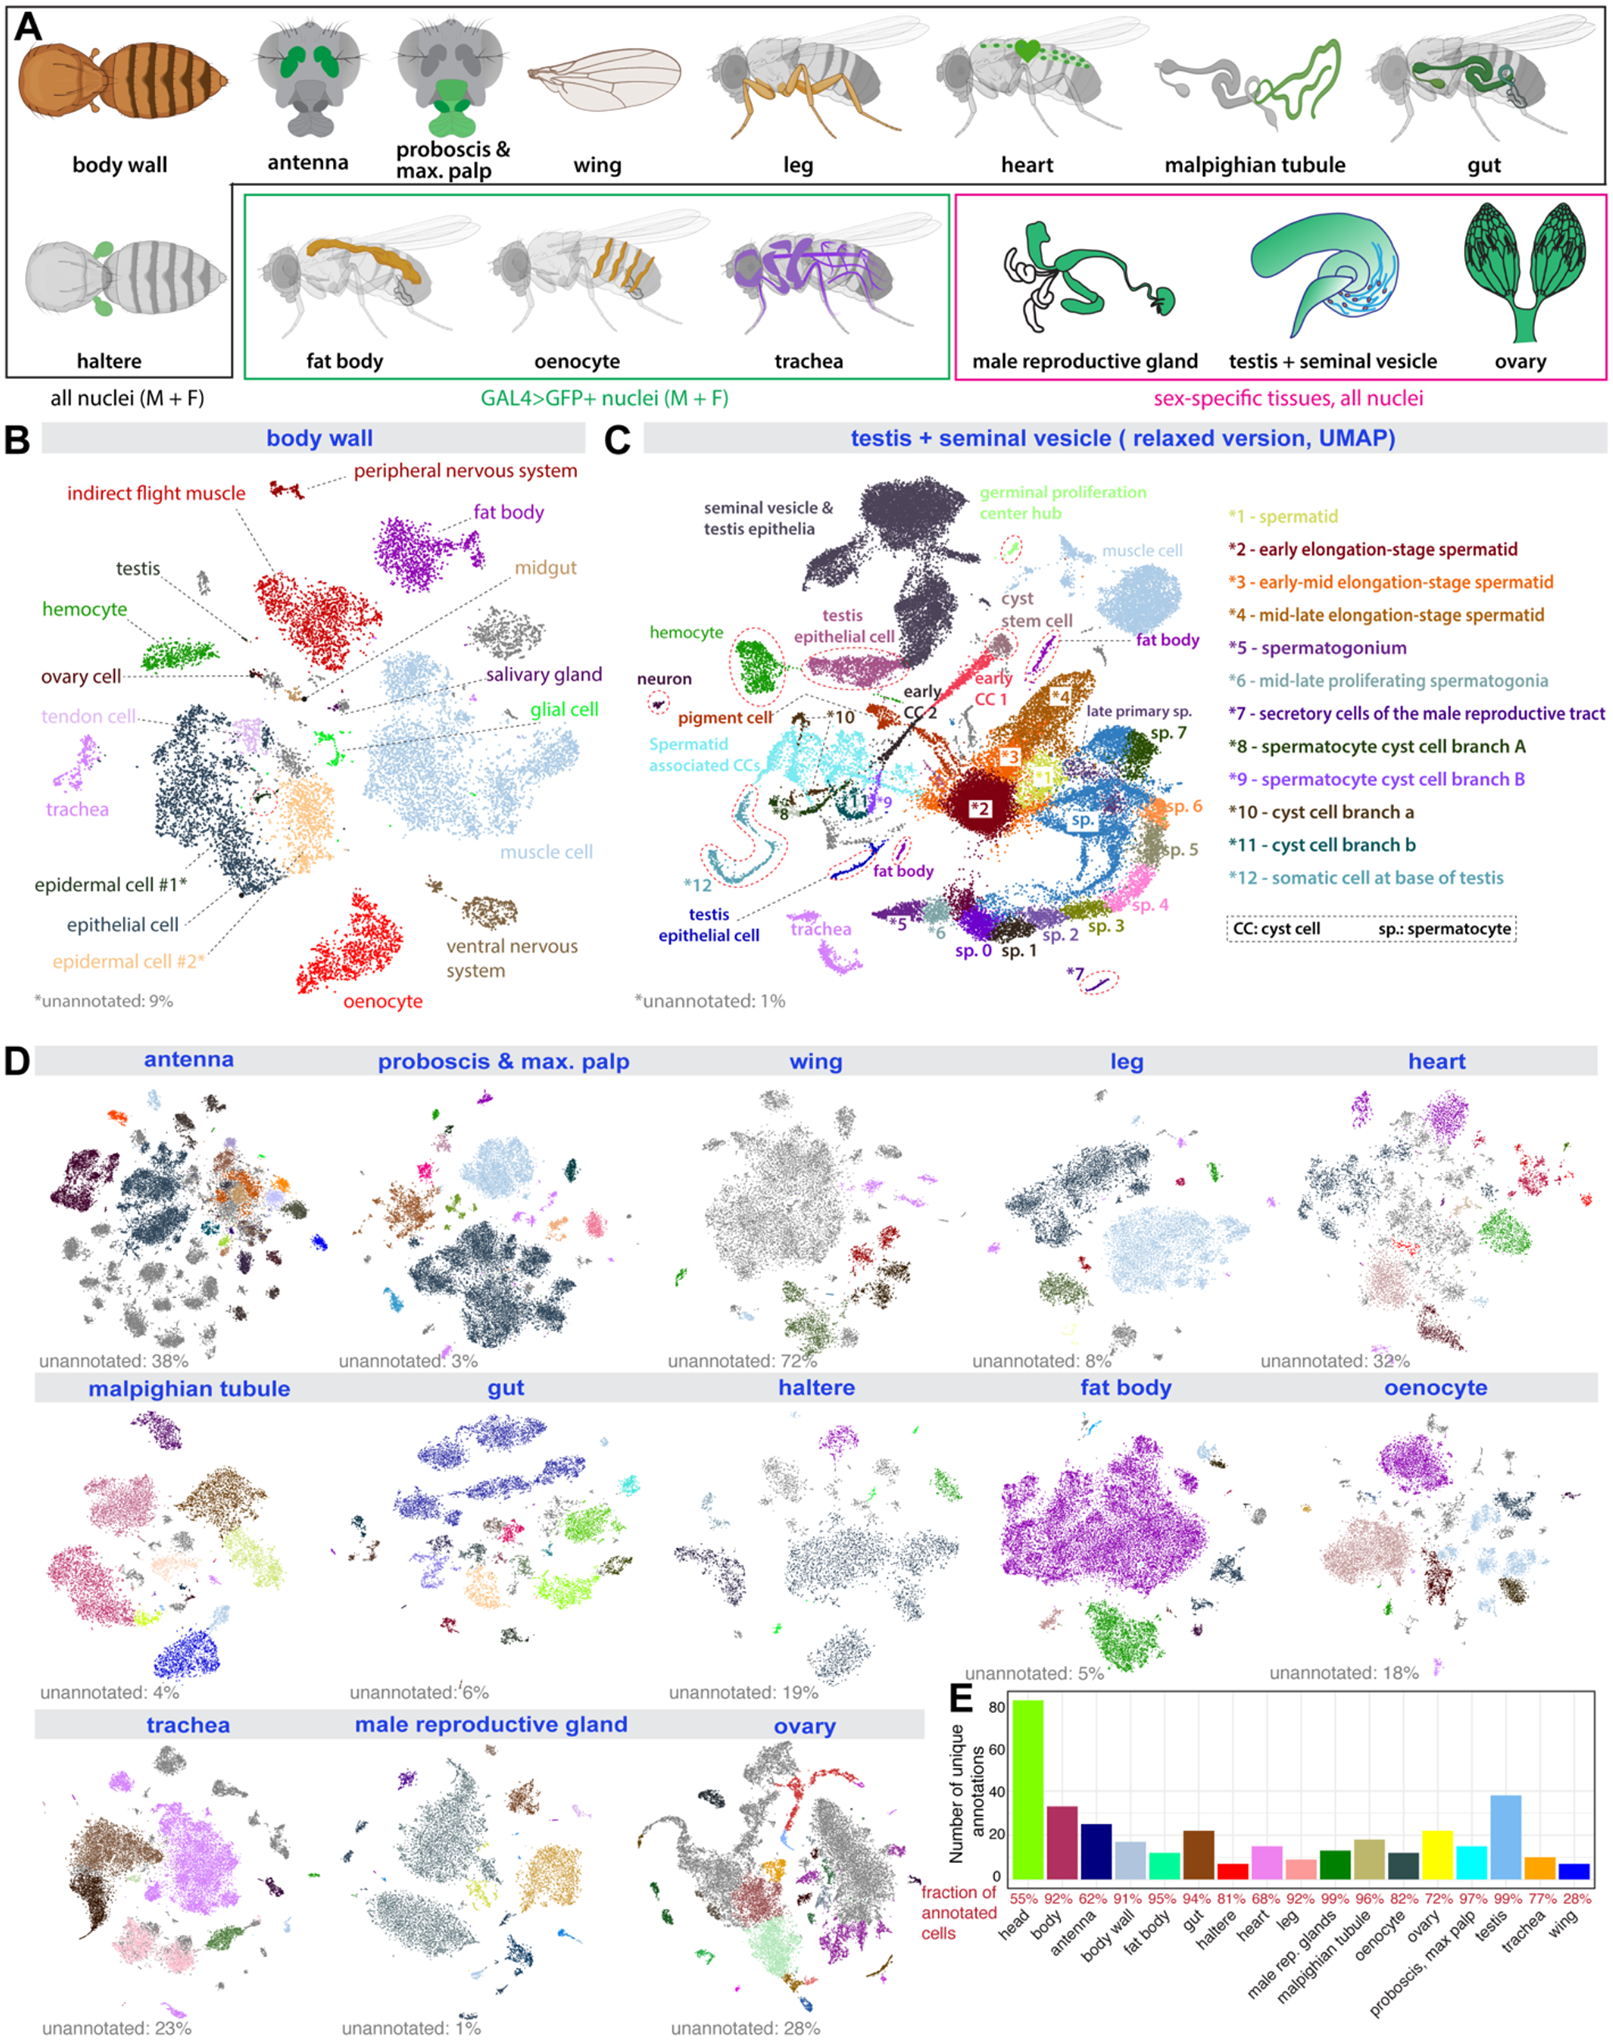
Figure 2: Cell type annotation for dissected tissues.

(A) Illustration of 15 individual tissues. 12 sequenced separately from males and females, 3 sex-specific. Fat body, oenocyte, and tracheal nuclei were labeled using a tissue-specific GAL4 driving UAS-nuclearGFP.
(B) tSNE plot with annotations for body wall from the Stringent 10x dataset. *1, epidermal cells of the abdominal posterior compartment. *2, epidermal cells specialized in antimicrobial response.
(C) UMAP plot with annotations for the testis from the Relaxed 10x dataset.
(D) tSNE plots of the other 13 tissues from the Stringent 10x dataset. Detailed annotations are in fig. S6–S18.
(E) Number of unique annotations for each tissue. Fractions of annotated cells over all analyzed cells from the Relaxed dataset are indicated in red.
