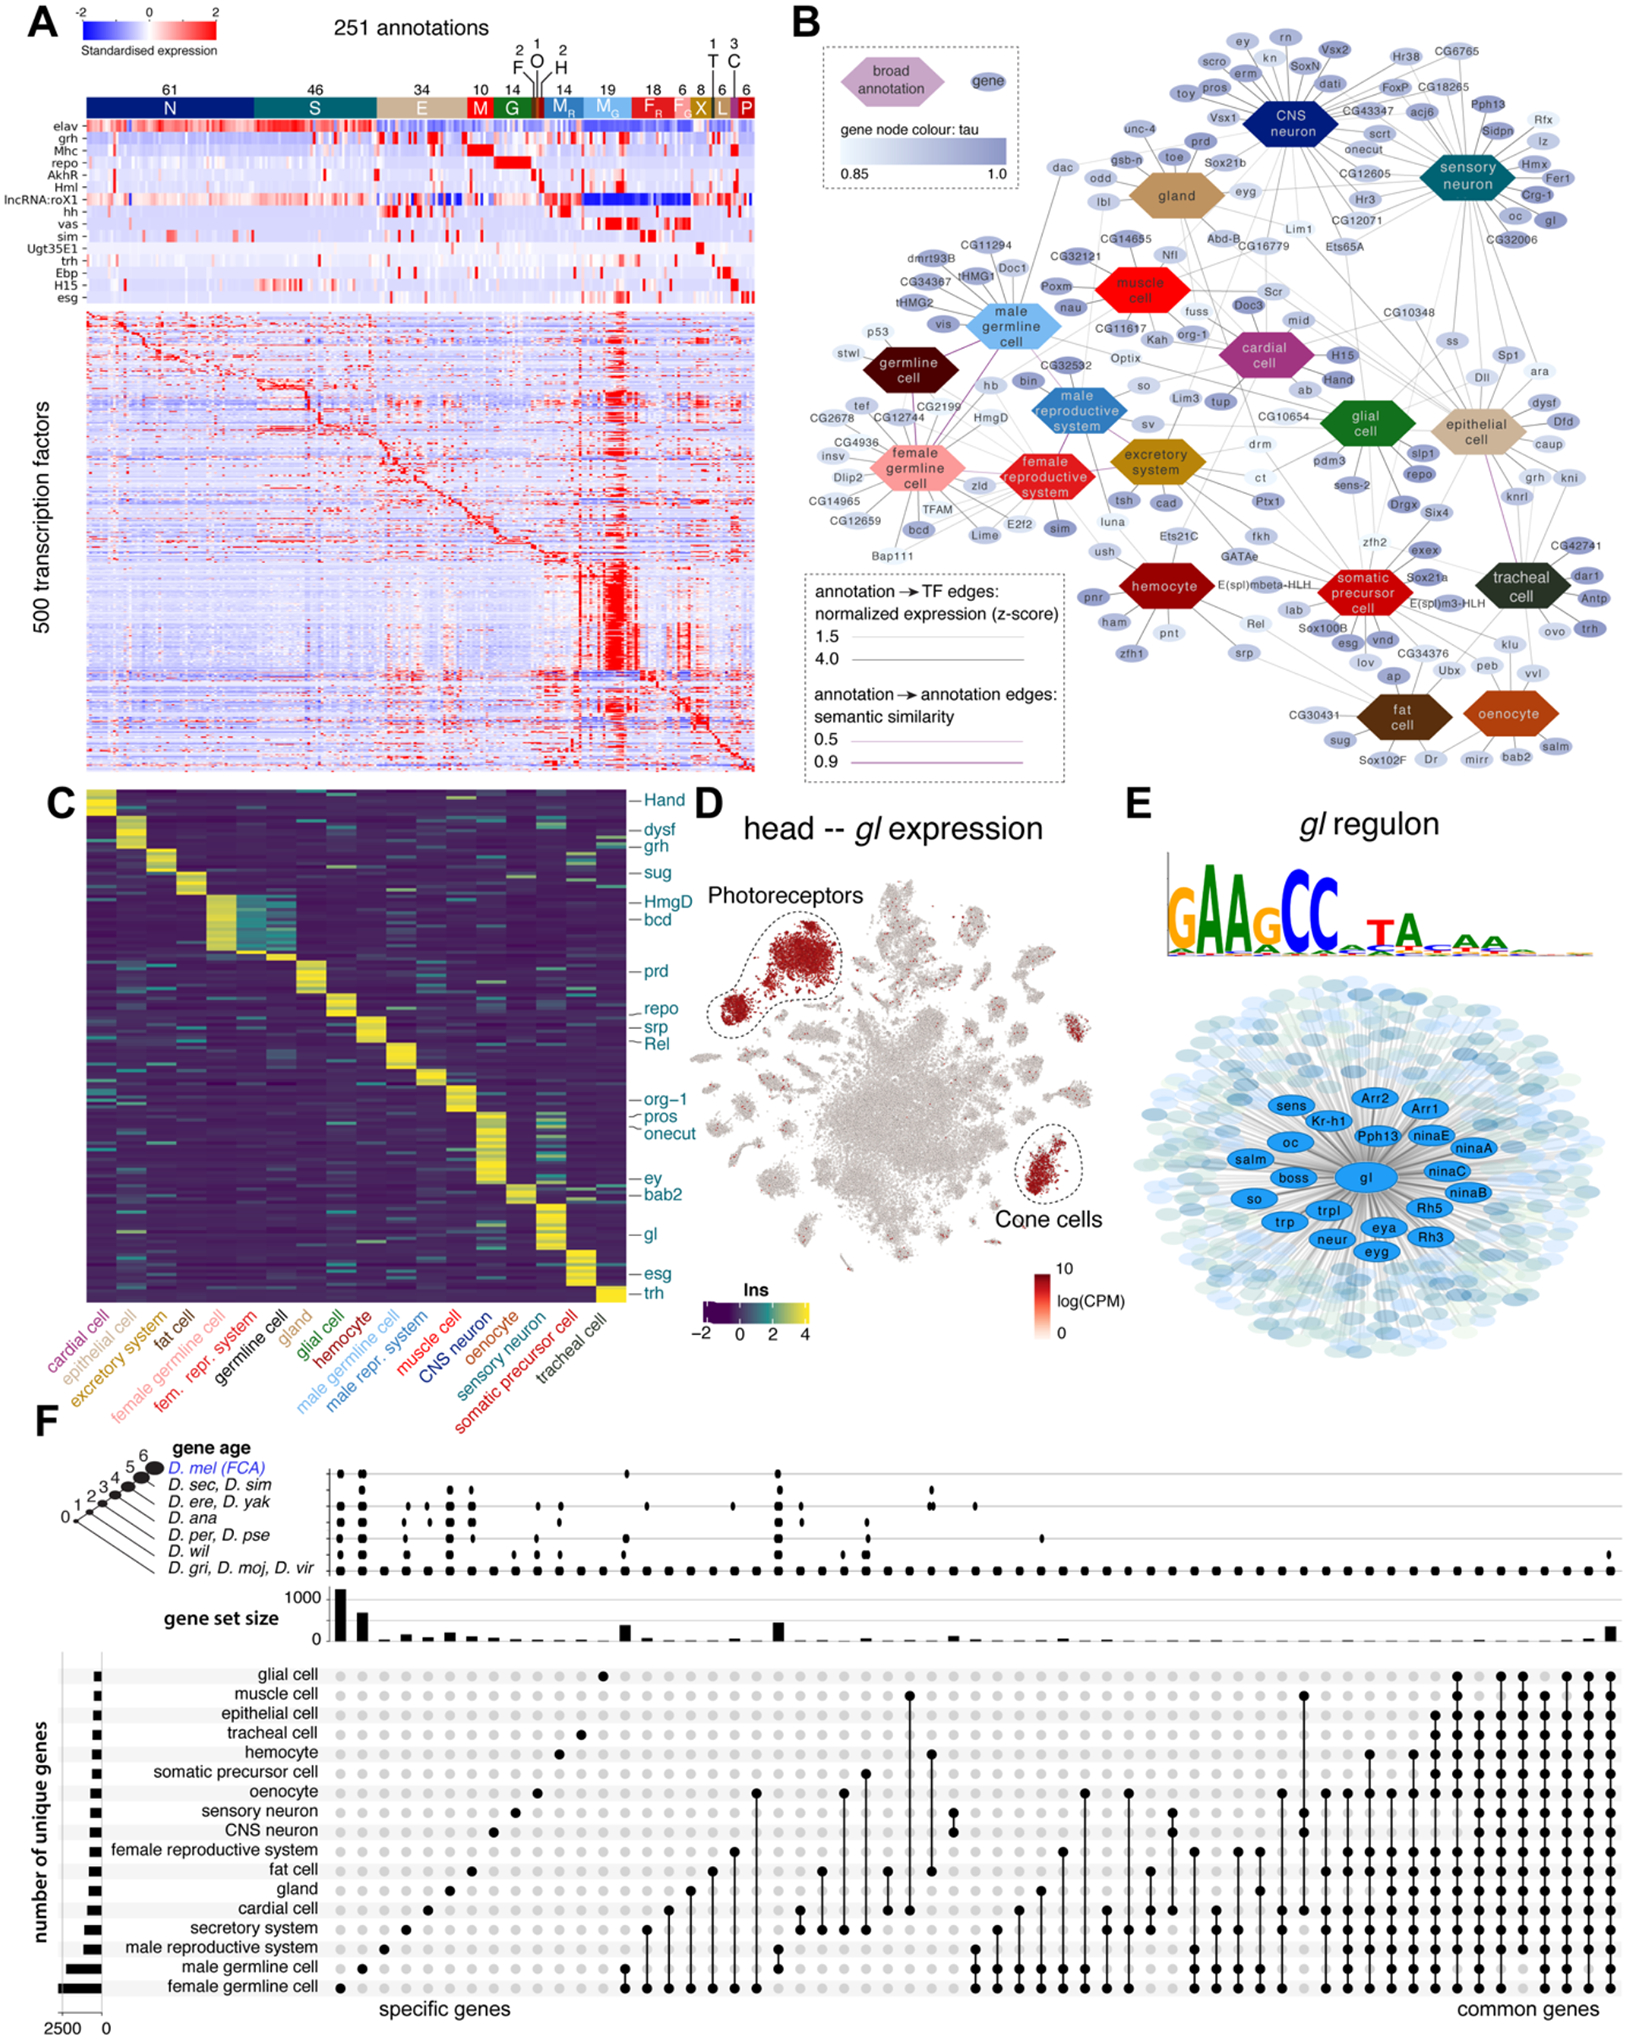
Figure 5: Transcription factor (TF) pleiotropy versus cell-type specificity.

(A) Heatmap showing the expression of key marker genes and unique TF profiles for each of the annotated cell types. TFs were selected based on tau score. Cell types were grouped based on hierarchical terms: CNS neurons (N), sensory organ cells (S), epithelial cells (E), muscle cells (M), glia (G), fat cells (F), oenocytes (O), hemocytes (H), (fe)male reproductive system and germline (MR, MG, FR, FG), excretory system (X), tracheal cell (T), gland (L), cardiac cell (C), somatic precursor cell (P).
(B) A network analysis of TFs and cell classes based on similarity of ontology terms, reveals unique and shared TFs across the individual tissues.
(C) Heatmap showing the expression of unique TFs per cell class. Factors from the literature are highlighted.
(D) Glass is uniquely expressed in photoreceptors and cone cells in the head.
(E) Overview of the Glass regulon of 444 target genes, highlighting known photoreceptor marker genes.
(F) Gene expression comparison across broad cell types. Only sets with more than 10 genes are shown. The left bar graph shows the number of uniquely expressed genes for each tissue. The top bar graph shows the gene age in branches, ranging from the common ancestor to Drosophila melanogaster-specific genes (http://gentree.ioz.ac.cn). See fig. S34 for tissue-based comparison.
