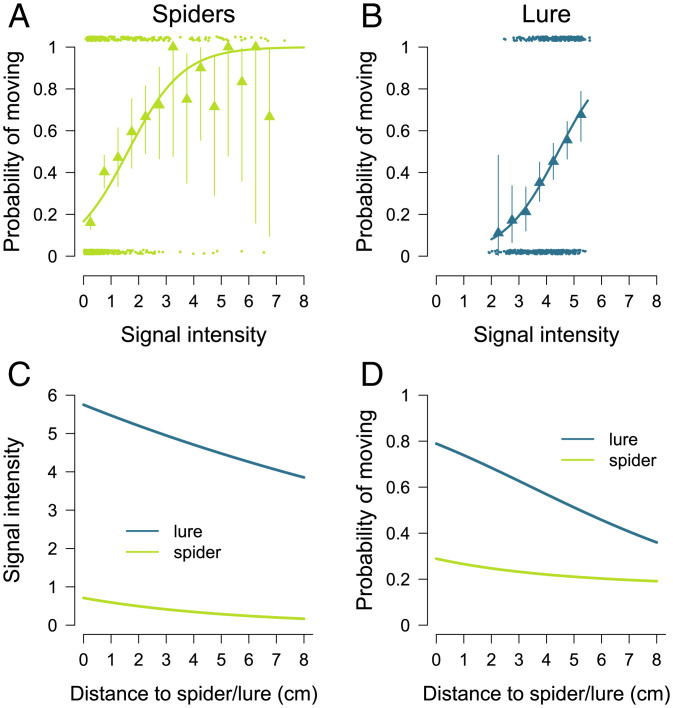
Fig. 2.
Individual response to signal intensity. Probabilities of moving in response to vibrations produced by spiders (A) or the lure (B). The dots (n = 830 for the spiders, n = 550 for the lure) give the observed events (move or not) as a function of the intensity of the signal received by a stopped individual at the preceding timestep (the positions of the dots were shifted along the y-axis for illustrative purpose). The triangles indicate the experimental proportion ±95% CI of spiders that moved as a function of signal strength by 0.5 interval. The lines give the predicted probabilities obtained with Eq. 4 for spiders ( = 0.71, kspider = 0.18 cm−1, and σspider =1.62) and Eq. 5 for the lure ( = 5.74, klure = 0.05 cm−1, and σlure = 4.42). (C) Predicted intensity of the signal perceived by a spider as a function of its distance from the lure or a single moving spider. (D) Predicted probability of moving in response to the lure or a single moving spider as a function of the distance to the immobile spider.

