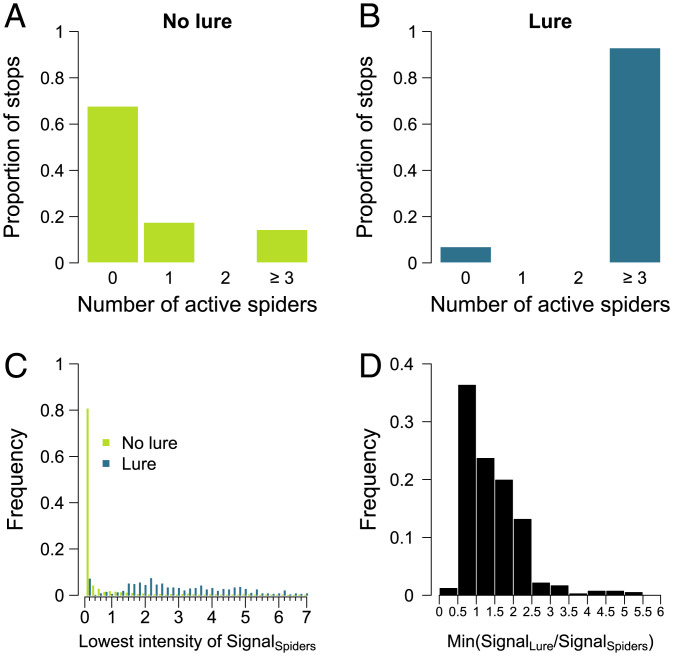
Fig. 4.
Influence of the presence of the lure on the decision to move. (A and B) Proportion of stops where 0, 1, 2, or 3 spiders were active in absence (n = 1,179) or presence (n = 471) of the lure. (C) Lowest intensity of the signal produced by spiders (SignalSpiders) perceived during one timestep by an individual when stopped in presence or absence of the lure. (D) Histogram of the minimum value of the ratio of lure signal divided by spider signal perceived by stopped individuals during one timestep before resuming movement (n = 438).

