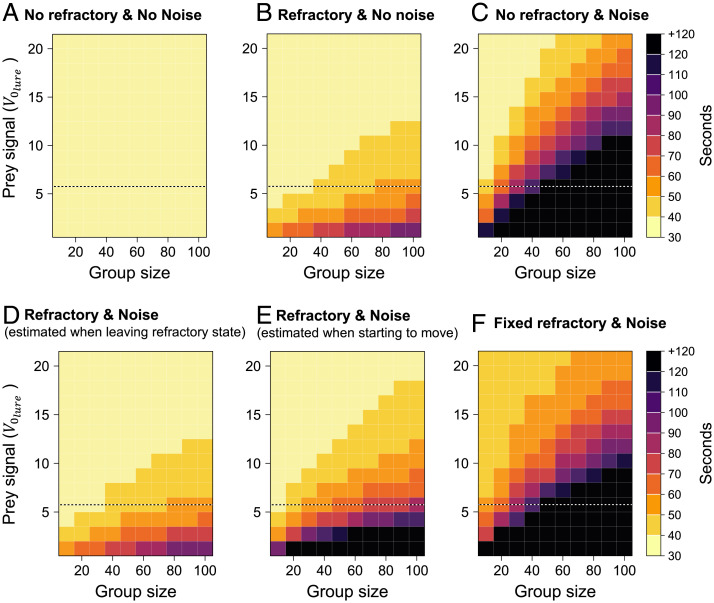
Fig. 6.
Prey capture efficiency. Each panel indicates the time required for 50% of the group to reach the prey as function of group size and prey signal intensity (varying in Eq. 5). Spiders obeyed or not a refractory state (refractory versus no refractory) and were influenced or not by the noise (noise versus no noise) produced by the moving spiders. The lure was active during the entire simulation. Simulations implementing an absence of refractory period and noise gives the best theoretical performance (A). B and C give the latency to reach the prey when only the refractory period or only the noise was implemented. In the presence of a refractory state and noise, spiders determined the noise level and the angle of their move toward the prey either when leaving the refractory state (D) or when starting to move (E). For all conditions, the duration of the refractory state was variable and ended when the strength of the signal emitted by the prey was more than one-half the strength of the signal produced by the mobile spiders except in (F), where the duration of the refractory period was fixed and equal to 0.16 s. Spiders that did not reach their prey within 120 s received a +120 value. The dotted line indicates the value of measured experimentally.

