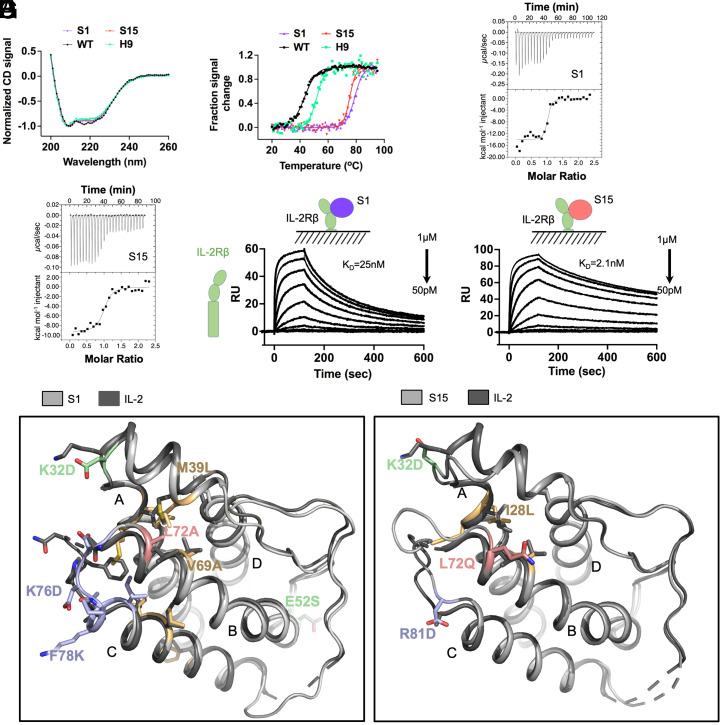
Fig. 3.
Increased stability and binding affinity, and structures, of stabIL-2 S1 and S15. (A) S1 and S15 designs adopt secondary structure profiles similar to WT and H9 as measured by far-UV CD. (B) Thermal stability of S1, S15, WT, and H9 assessed by heat denaturation monitored by CD at 222 nm. (C and D) Thermodynamic binding affinity of S1 (C) and S15 (D) against IL-2Rβ compared to WT and H9, measured by isothermal titration calorimetry. (E and F) Steady-state binding affinity of S1 (E) and S15 (F) against IL-2Rβ ECD compared to WT and H9, measured by surface plasmon resonance. (G) Crystal structures of S1 (Left, PDB: 7RA9) and S15 (Right, PDB: 7RAA) overlaid against WT (PDB: 1M47). Helices A to D are labeled on each structure.

