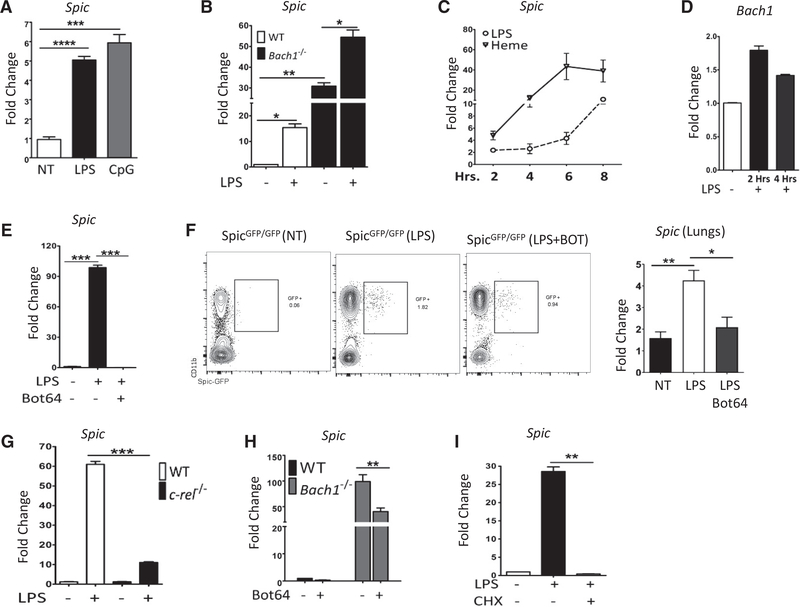
Figure 5. NF-κB Is Required for Spic Expression.
(A) BMDMs from WT mice were treated with LPS (100 ng/ml) or TLR9 ligand CpG (30 μg/ml), RNA was extracted 8 h later, and the expression (normalized to 18S rRNA) of Spic was measured (y axis, relative to no treatment) by qRT-PCR.
(B) WT and Bach1−/− Mo-MACs were treated with LPS (100 ng/ml), RNA was harvested 24 h later, and the expression (normalized to Hprt)of Spic was measured (y axis, relative to WT no treatment) by qRT-PCR.
(C) WT BMDMs were treated with LPS (100 ng/ml) or hemin (80 μM), RNA was extracted at indicated (x axis, hours) time points, and the expression (normalized to 18S rRNA)of Spic was measured (y axis, relative to no treatment) by qRT-PCR.
(D) WT Mo-MACs were treated with LPS (1 μg/ml), RNA was extracted at indicated time points (x axis), and expression of Bach1 (normalized to 18S rRNA) was measured (y axis, relative to no treatment) by qRT-PCR.
(E) WT Mo-MACs were treated with LPS (1 μg/ml) with or without an Iκκ-2 inhibitor, Bot64 (10 μM). RNA was extracted 18 h later, and the expression (normalized to 18S rRNA)of Spic was measured (y axis, relative to no treatment) by qRT-PCR.
(F) Mice of indicated genotypes (header) were treated with LPS with or without Bot64 (i.p.). Bot64 treatment (60 mg/kg/day for 3 days) started 24 h before LPS (single dose, 100 μg/mouse) treatment. Peripheral blood and lungs were collected 24 h after LPS treatment. FCS plots (left) show the distribution of indicated markers in peripheral blood (cells pre-gated for CD45+ Ly6G- singlets). The expression (relative to Hprt)of Spic in the lungs (measured by qRT-PCR) is shown in the right plot.
(G) WT or c-rel−/− Mo-MACs were treated with LPS (1 μg/ml), RNA was extracted 16 h later, and the expression (normalized to Hprt)of Spic was measured (y axis, relative to WT no treatment) by qRT-PCR.
(H) WT and Bach1−/− Mo-MACs were treated with an Iκκ-2 inhibitor, Bot64 (10 μM), RNA was extracted 14 h later, and the expression of Spic (normalized to 18S rRNA) was measured (y axis, relative to WT no treatment) by qRT-PCR.
(I) WT Mo-MACs were treated with LPS (1 μg/ml) alone or with cycloheximide (10 μg/ml, added 1 h before LPS) to inhibit new protein synthesis. RNA was harvested 8 h later, and the expression (normalized to Hprt)of Spic was measured (y axis, relative to no treatment) by qRT-PCR.
FCS, numbers represent percentage of cells within indicated gate. (F) Represents 2 experiments with ≥3 mice per group. qRT-PCR, representative of ≥3 independent experiments and graphs show single experiment with n ≥2 per group. Results expressed as mean ± SEM. p ≤ 0.05 (*), p ≤ 0.01 (**), p ≤ 0.001 (***), and p ≤ 0.0001 (****). See also Figure S4.

