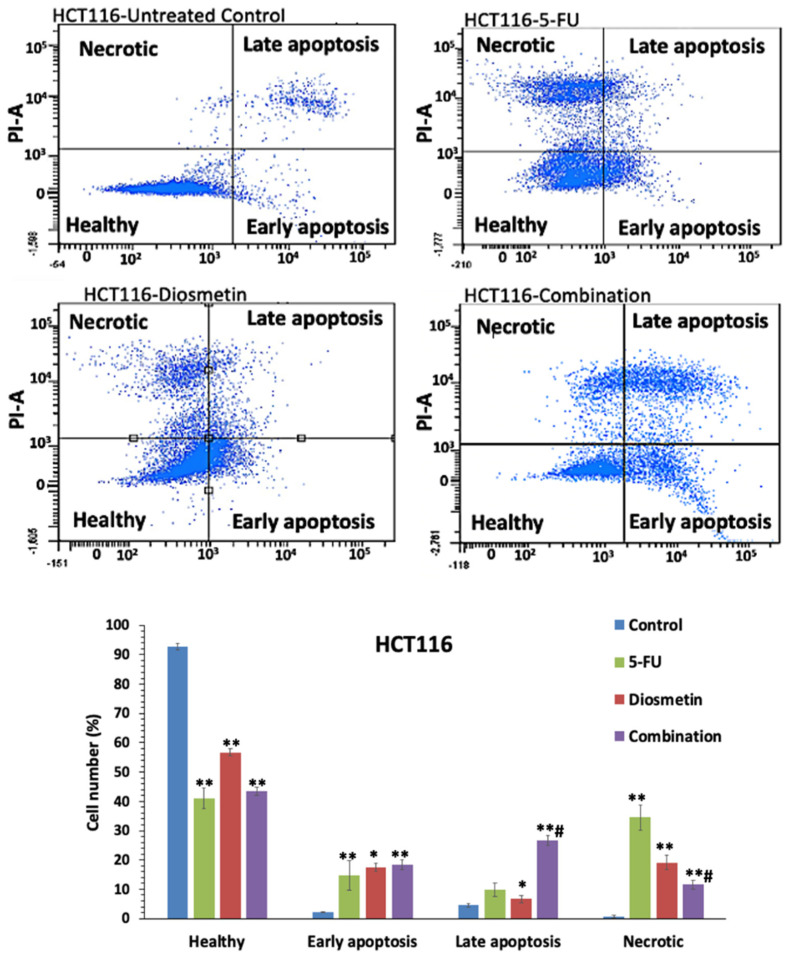
Figure 12.
Flow cytometry graphs and apoptosis quantification in HCT116 cells after 72 h of monotherapy and combination therapy. The control group remained untreated. Total apoptotic cells (early apoptosis + late apoptosis): 5-FU: 24.6%, diosmetin: 24.1%, combination: 45%. Data are presented as mean ± SD, * p < 0.05, ** p < 0.01 indicates significant difference compared with control, # p < 0.01 indicates significant difference between combination-treated cells and 5-FU-treated cells.

