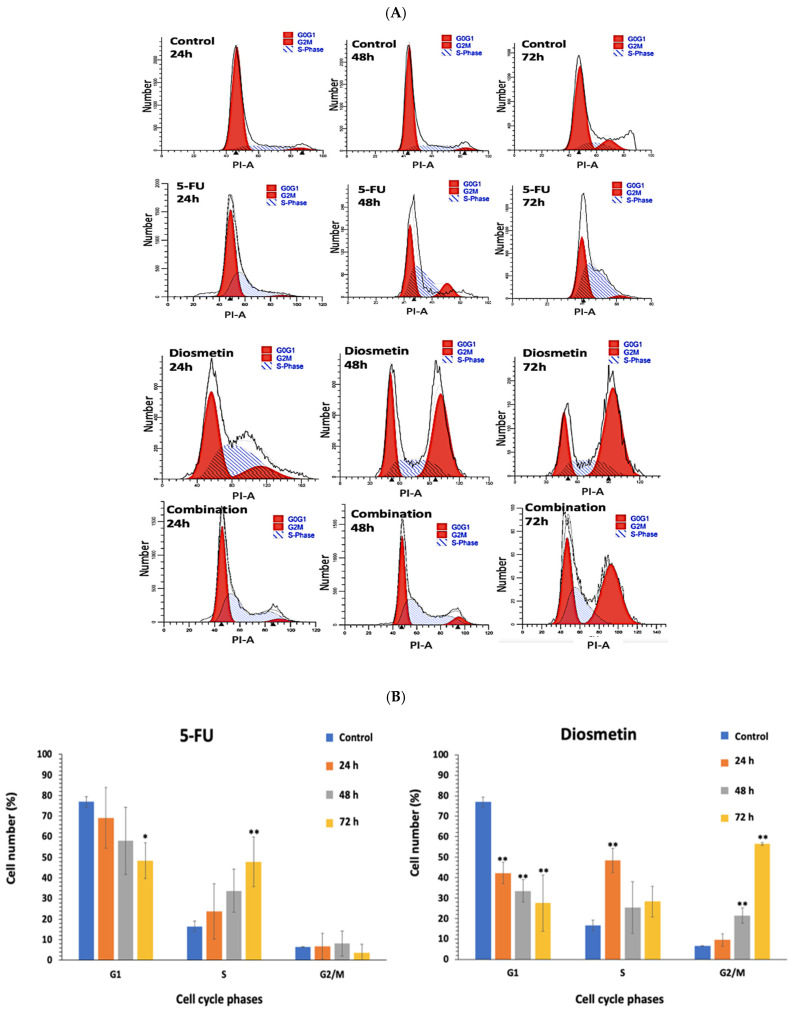
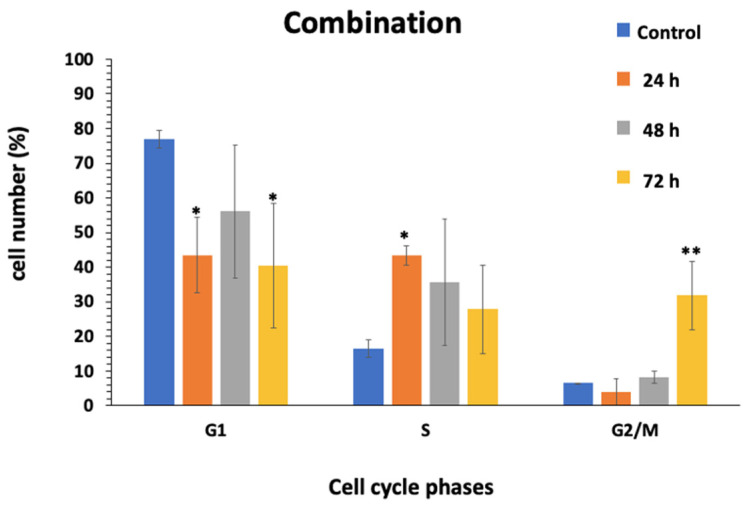
Figure 13.
(A) DNA histograms of monotherapy and combination therapy on HCT116 cell cycle profile. The first and second peaks represent DNA content in G0/G1 and G2/M phases. Cell number plotted against the intensity of PI. Flow cytometric histograms are representative of 3 separate experiments. (B) Cell distribution percentage in each phase of HCT116 cell cycle. Data are presented as mean ± SD of 3 separate experiments, * p < 0.05, ** p < 0.01 indicate significant difference compared to control.


